Access free live classes and tests on the app
Download
+
Unacademy
  • Goals
    • AFCAT
    • AP EAMCET
    • Bank Exam
    • BPSC
    • CA Foundation
    • CAPF
    • CAT
    • CBSE Class 11
    • CBSE Class 12
    • CDS
    • CLAT
    • CSIR UGC
    • GATE
    • IIT JAM
    • JEE
    • Karnataka CET
    • Karnataka PSC
    • Kerala PSC
    • MHT CET
    • MPPSC
    • NDA
    • NEET PG
    • NEET UG
    • NTA UGC
    • Railway Exam
    • SSC
    • TS EAMCET
    • UPSC
    • WBPSC
    • CFA
Login Join for Free
avtar
  • ProfileProfile
  • Settings Settings
  • Refer your friendsRefer your friends
  • Sign outSign out
  • Terms & conditions
  • •
  • Privacy policy
  • About
  • •
  • Careers
  • •
  • Blog

© 2023 Sorting Hat Technologies Pvt Ltd

Watch Free Classes
    • Free courses
    • JEE Main 2024
    • JEE Main 2024 Live Paper Discussion
    • JEE Main Rank Predictor 2024
    • JEE Main College Predictor 2024
    • Stream Predictor
    • JEE Main 2024 Free Mock Test
    • Study Materials
    • Notifications
    • JEE Advanced Syllabus
    • JEE Books
    • JEE Main Question Paper
    • JEE Coaching
    • Downloads
    • JEE Notes & Lectures
    • JEE Daily Videos
    • Difference Between
    • Full Forms
    • Important Formulas
    • Exam Tips
JEE Main 2026 Preparation: Question Papers, Solutions, Mock Tests & Strategy Unacademy » JEE Study Material » Mathematics » Discrete Frequency Distribution

Discrete Frequency Distribution

In the following article we are going to know about discrete frequency distribution.

Table of Content
  •  

Frequency distribution in statistics is a list, table (i.e., frequency table), or graph (i.e., bar plot or histogram) that shows the frequency of different outcomes in a sample. The frequency or count of occurrences of values within a certain group or interval is contained in each table entry. A frequency distribution illustrates the number of occurrences in each class and a summarised grouping of data sorted into mutually exclusive groupings. It is a method of displaying disorganised data, such as election results, people’s income in a specific location, product sales during a specific time period, graduate student debt amounts, and so on. Histograms, line charts, bar charts, and pie charts are examples of graphs that can be used with frequency distributions. For both qualitative and quantitative data, frequency distributions are used.

Frequency Distribution Types

In statistics, there are four types of frequency distributions, which are described below:

An ungrouped frequency distribution shows the frequency of an item in each individual data value rather than groups of data values.

The data is sorted and segregated into groups called class intervals in a grouped frequency distribution. In a frequency distribution table, the frequency of data corresponding to each class interval is recorded. The grouped frequency table depicts the frequency distribution in class intervals.

The relative frequency distribution determines the proportion of the total number of observations associated with each category.

In a frequency distribution, the cumulative frequency distribution is the sum of the initial frequency and all frequencies below it. You must add one value to the next, then add the sum to the next, and so on until the last value is reached. The end cumulative frequency will be the total of all frequencies.

A discrete distribution is one in which the data can only take one of a few possible values, such as integers. A continuous distribution is one in which data can take on any value within a given range of values (which may be infinite). The values in a discrete distribution can be assigned probabilities – for example, “the probability that the web page will have 12 hits in an hour is 0.15.” A continuous distribution, on the other hand, has an infinite number of possible values, and the probability associated with any one of those values is null. As a result, continuous distributions are frequently characterised in terms of probability density, which may be translated into the likelihood that a value will fall inside a given range.

Definition of Discrete Frequency Distribution

Let the given data consist of n different values x1, x2…, xn, each with a frequency of f1, f2,…, fn. Then, as shown below, this data can be represented in tabular form with variables and related frequencies, resulting in a discrete frequency distribution:

The occurrences of data values such as observation x1 occur f1 times, x2 occur f2 times, and so on are described in the table above.

The values of the variable are thus decided individually in a discrete frequency distribution. The frequency of a value or observation is determined by the number of times it appears. Ungrouped frequency distribution is another name for discrete frequency distribution.

Table of Frequency Distribution

A frequency distribution table is a graph that illustrates how often each item in a data set occurs. To see how to build a frequency distribution table with tally marks, examine the following example. Red, green, blue, black, red, green, blue, yellow, red, red, green, green, green, yellow, red, green, yellow, red, green, yellow, red, green, yellow, red, green, yellow, red, green, yellow, red, green, yellow, red, green, yellow, red, green, yellow, red, green, yellow, red, green, yellow, red, green, yellow, red We must first classify the beads into groups in order to determine the exact quantity of beads of each hue. Using tally markings is a simple approach to determine the number of beads of each colour. Pick up the beads one by one and place them in the appropriate row and column. Then, for each item in the table, note the frequency.

Construction of Discrete Frequency Distribution

Tally markings can be used to create a discrete frequency distribution table for easy understanding and precise results. The following example will help you understand what I’m talking about:

Example:

The following are the results of a monthly test in which 25 students received a total of 20 points. Make a discrete frequency distribution of the data.

15, 13, 16, 16, 15, 16, 17, 14, 15, 16, 16, 17, 14, 15, 16, 16, 17, 14, 15, 16, 16, 17, 14, 15, 16, 16, 17, 14, 15, 16, 16, 17, 14, 16, 15, 17, 13

Ans-

Given :

17, 16, 14, 15, 16, 17, 14, 16, 15, 17, 13,15, 13, 16, 16, 15, 16, 17, 14, 15, 16, 16,17, 14, 17


This can be represented as:

When the number of data values is tiny, a discrete frequency distribution table is created. If there are more observations, a grouped frequency table must be prepared for easy calculation. Many statistical issues will benefit from this method of data grouping. In addition, we can create a frequency table without the need of tally marks.

Discrete Frequency Distribution Mean

With the right formulas, we may find the measures of central tendency for any discrete frequency distribution. With the help of the solved example below, let’s learn how to find the mean given a discrete distribution of data:

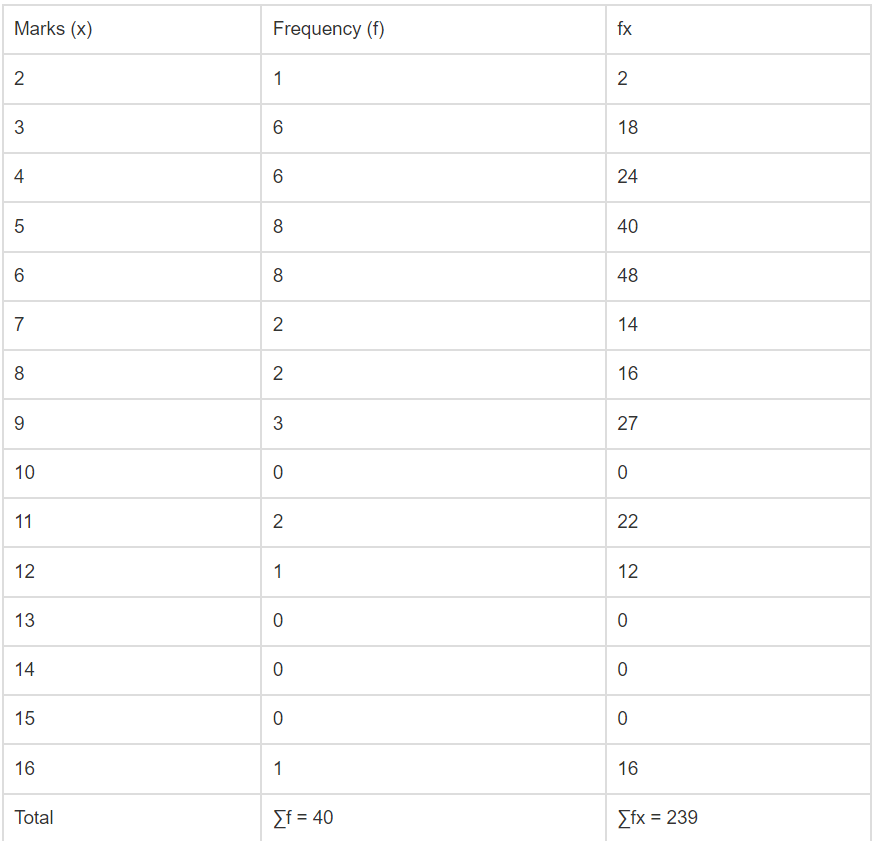
Q-) Evaluate the mean of the given data:


Answer: 


Mean = ∑f(x)/∑f = 239/40 = 5.975

Conclusion

A discrete frequency distribution is a table that shows each number and the number of times it appears in a list (frequency). The numbers are usually integers, but other step sizes (such as tenths) are acceptable as long as each number is an integral multiple of the step size.A continuous frequency distribution, on the other hand, requires the data to be grouped into set width intervals, with the frequency being the number of numbers in the list that fall within each interval.

faq

Frequently Asked Questions

Get answers to the most common queries related to the JEE Examination Preparation.

What is discrete data?

Ans- Discrete data is a count that uses integers and has a finite number of possible values. This type of informatio...Read full

What is continuous data?

Ans- Continuous data is information that can be measured on an endless scale and can have any value between two numb...Read full

What is frequency distribution?

Ans- A frequency distribution is a graphical or tabular representation that shows the number of observations within ...Read full

Ans- Discrete data is a count that uses integers and has a finite number of possible values. This type of information can’t be broken down into smaller chunks

Ans- Continuous data is information that can be measured on an endless scale and can have any value between two numbers, regardless of how small. Almost any value on the scale can be used as the measure.

Ans- A frequency distribution is a graphical or tabular representation that shows the number of observations within a specified interval.

Crack IIT JEE with Unacademy

Get subscription and access unlimited live and recorded courses from India’s best educators

  • Structured syllabus
  • Daily live classes
  • Ask doubts
  • Tests & practice
Learn more

Notifications

Get all the important information related to the JEE Exam including the process of application, important calendar dates, eligibility criteria, exam centers etc.

Allotment of Examination Centre
JEE Advanced Eligibility Criteria
JEE Advanced Exam Dates
JEE Advanced Exam Pattern 2023
JEE Advanced Syllabus
JEE Application Fee
JEE Application Process
JEE Eligibility Criteria 2023
JEE Exam Language and Centres
JEE Exam Pattern – Check JEE Paper Pattern 2024
JEE Examination Scheme
JEE Main 2024 Admit Card (OUT) – Steps to Download Session 1 Hall Ticket
JEE Main Application Form
JEE Main Eligibility Criteria 2024
JEE Main Exam Dates
JEE Main Exam Pattern
JEE Main Highlights
JEE Main Paper Analysis
JEE Main Question Paper with Solutions and Answer Keys
JEE Main Result 2022 (Out)
JEE Main Revised Dates
JEE Marking Scheme
JEE Preparation Books 2024 – JEE Best Books (Mains and Advanced)
Online Applications for JEE (Main)-2022 Session 2
Reserved Seats
See all

Related articles

Learn more topics related to Mathematics
Zero Vector

A zero vector is defined as a line segment coincident with its beginning and ending points. Primary Keyword: Zero Vector

ZERO MATRIX

In this article, we will discuss about the zero matrix and it’s properties.

YARDS TO FEET

In this article we will discuss the conversion of yards into feet and feets to yard.

XVI Roman Numeral

In this article we are going to discuss XVI Roman Numerals and its origin.

See all
Access more than

10,505+ courses for IIT JEE

Get subscription

Trending Topics

  • JEE Main 2024
  • JEE Main Rank Predictor 2024
  • JEE Main Mock Test 2024
  • JEE Main 2024 Admit Card
  • JEE Advanced Syllabus
  • JEE Preparation Books
  • JEE Notes
  • JEE Advanced Toppers
  • JEE Advanced 2022 Question Paper
  • JEE Advanced 2022 Answer Key
  • JEE Main Question Paper
  • JEE Main Answer key 2022
  • JEE Main Paper Analysis 2022
  • JEE Main Result
  • JEE Exam Pattern
  • JEE Main Eligibility
  • JEE College predictor
combat_iitjee

Related links

  • JEE Study Materials
  • CNG Full Form
  • Dimensional Formula of Pressure
  • Reimer Tiemann Reaction
  • Vector Triple Product
  • Swarts Reaction
  • Focal length of Convex Lens
  • Root mean square velocities
  • Fehling’s solution
testseries_iitjee
Predict your JEE Rank
.
Company Logo

Unacademy is India’s largest online learning platform. Download our apps to start learning


Starting your preparation?

Call us and we will answer all your questions about learning on Unacademy

Call +91 8585858585

Company
About usShikshodayaCareers
we're hiring
BlogsPrivacy PolicyTerms and Conditions
Help & support
User GuidelinesSite MapRefund PolicyTakedown PolicyGrievance Redressal
Products
Learner appLearner appEducator appEducator appParent appParent app
Popular goals
IIT JEEUPSCSSCCSIR UGC NETNEET UG
Trending exams
GATECATCANTA UGC NETBank Exams
Study material
UPSC Study MaterialNEET UG Study MaterialCA Foundation Study MaterialJEE Study MaterialSSC Study Material

© 2026 Sorting Hat Technologies Pvt Ltd

Unacademy
  • Goals
    • AFCAT
    • AP EAMCET
    • Bank Exam
    • BPSC
    • CA Foundation
    • CAPF
    • CAT
    • CBSE Class 11
    • CBSE Class 12
    • CDS
    • CLAT
    • CSIR UGC
    • GATE
    • IIT JAM
    • JEE
    • Karnataka CET
    • Karnataka PSC
    • Kerala PSC
    • MHT CET
    • MPPSC
    • NDA
    • NEET PG
    • NEET UG
    • NTA UGC
    • Railway Exam
    • SSC
    • TS EAMCET
    • UPSC
    • WBPSC
    • CFA

Share via

COPY