Access free live classes and tests on the app
Download
+
Unacademy
  • Goals
    • AFCAT
    • AP EAMCET
    • Bank Exam
    • BPSC
    • CA Foundation
    • CAPF
    • CAT
    • CBSE Class 11
    • CBSE Class 12
    • CDS
    • CLAT
    • CSIR UGC
    • GATE
    • IIT JAM
    • JEE
    • Karnataka CET
    • Karnataka PSC
    • Kerala PSC
    • MHT CET
    • MPPSC
    • NDA
    • NEET PG
    • NEET UG
    • NTA UGC
    • Railway Exam
    • SSC
    • TS EAMCET
    • UPSC
    • WBPSC
    • CFA
Login Join for Free
avtar
  • ProfileProfile
  • Settings Settings
  • Refer your friendsRefer your friends
  • Sign outSign out
  • Terms & conditions
  • •
  • Privacy policy
  • About
  • •
  • Careers
  • •
  • Blog

© 2023 Sorting Hat Technologies Pvt Ltd

Watch Free Classes
    • Free courses
    • JEE Main 2024
    • JEE Main 2024 Live Paper Discussion
    • JEE Main Rank Predictor 2024
    • JEE Main College Predictor 2024
    • Stream Predictor
    • JEE Main 2024 Free Mock Test
    • Study Materials
    • Notifications
    • JEE Advanced Syllabus
    • JEE Books
    • JEE Main Question Paper
    • JEE Coaching
    • Downloads
    • JEE Notes & Lectures
    • JEE Daily Videos
    • Difference Between
    • Full Forms
    • Important Formulas
    • Exam Tips
JEE Exam » JEE Study Material » Mathematics » Correlation

Correlation

Correlation can be described as the method by which we establish a relationship between a couple of variables.

Table of Content
  •  

Now we will see how the topic of Correlation is used in statistics. Correlation is very useful when you have two variables and you have to determine a relationship between those two variables. So, Correlation is used to determine or establish a relationship between two variables. In this article, we will discuss how to measure this “Correlation” between two variables. The Correlation between two variables can be measured using a quantity called the Correlation Coefficient. 

Correlation Coefficient

As we have discussed earlier, the Correlation Coefficient is used to measure the Correlation between two variables. The Correlation in turn is used to determine what type of relationship exists between the two variables. Now we will see how to calculate that Correlation Coefficient. One of the most popular approaches to calculating the Correlation Coefficient is to calculate Pearson’s Correlation, one of the most popular Correlation Coefficients. 

Pearson’s Correlation is used mostly in the case of Linear Regression problems. Pearson’s Correlation is more commonly known as Pearson Product Moment Correlation (PPMC). Some disadvantages of this Correlation Coefficient are:-

  1. Pearson Product Moment Correlation cannot differentiate between a Dependent Variable and an Independent Variable.
  2. It is inconsistent with different sets of data. So we have to be very careful when dealing with different sets of data with Pearson’s Correlation.
  3. In a Person’s Correlation, we draw a line if there’s a relation between two sets of data. Pearson’s Correlation will not give you the slope of the line, it will only tell you if a line can be drawn.

Now we will see how to calculate The Pearson’s Correlation Coefficient. 

The formula for finding The Pearson’s Correlation Coefficient is:-

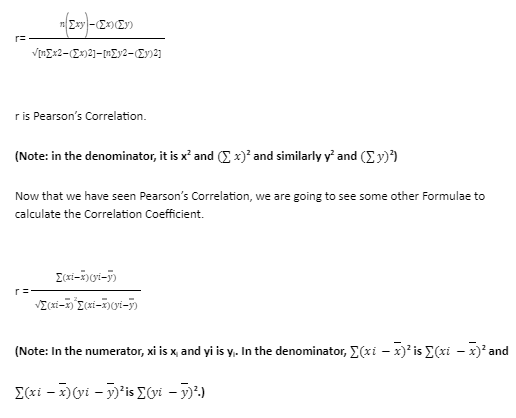
(Note: This formula is just another variation of the Pearson’s Correlation Coefficient.)

In this formula,

r: Pearson’s Correlation Coefficient.

xi: Value of the x-variable.

yi: Value of the y-variable.

x̅: Mean of the values of the x-variable.

y̅: Mean of the values of the y-variable.

Now we will the concept of Diagram which will help us to better understand this topic.

Scatter Diagram

To get the Scatter Diagram, we plot the values of the first variable along one axis and the values of the second variable along the other axis. For example, if we have an x-variable and another variable y-variable, we could plot the values of the x-variable along the X-axis and the values of the y-variable along the Y-axis. Now we apply the Regression Model. So what the application of the Regression Model does is that it gives rise to one Dependent Variable and one Independent Variable. The Independent Variable will have some kind of effect on the Dependent Variable. The use of the Scatter Diagram is that it helps us in determining the type of Correlation between the two variables. The type of Correlation between the two variables is determined by the direction in which the plot is moving.

Types of Correlation

When we draw a Scatter Diagram representing the two variables for which we want to find out the correlation. So there can be 3 possible types of Correlations based on the Scatter Diagram drawn between the two variables. 

  1. Positive Correlation: – When we draw the Scatter Diagram for the two variables and we find out the change in the values of both the variables move in the same directions, it means that there exists a Positive Correlation between the two variables. So what basically means that if the value of one variable increases, the value of the other variable also increases. While, if the value of one variable decreases, the value of the other variable decreases. An example of Positive Correlation is the relationship between time and distance. If two particular places are located far away (increase), the time taken to go from one place to another is also more (increase) and vice-versa.
  2. Negative Correlation: – When we draw the Scatter Diagram for the two variables and we find out that the change in the values of both the variables moves in different directions, it means that the two variables have a Negative Correlation between them. What that implies is that, if the value of one variable increases, the value of the other variable decreases. An example of a Negative Correlation that can be considered is the relationship between the Speed of a vehicle and the time taken by the vehicle to go from one place to other. If the Speed of a vehicle is more (increase), the time taken to go from one place to the other is less (decrease) and vice-versa.
  3. Zero Correlation: – The Zero Correlation is the implication that there exists absolutely no relationship between the fore-mentioned two variables. This basically means that the two variables are completely independent of each other. The increase and decrease in the value of one variable are independent of and don’t affect the increase and decrease in value of the other variable. An example of Zero Correlation is the relationship between the height of a student and his average marks in an exam.

Conclusion

In the article, we described the concept of Correlation. Then we moved on to learn the concept of how to calculate the Correlation Coefficient. After that, we learned what a Scatter Diagram is and how to draw one. Finally, we have discussed the three very important types of Correlation.

faq

Frequently asked questions

Get answers to the most common queries related to the JEE Examination Preparation.

What is Correlation?

Ans -Correlation is the term that describes the relationship between two variables.

What is a Correlation Coefficient?

Ans –The correlation coefficient is a mathematical entity that helps us ...Read full

What are the different types of Correlation?

Ans –There are 3 different types of correlation- ...Read full

Ans -Correlation is the term that describes the relationship between two variables.

Ans –The correlation coefficient is a mathematical entity that helps us to determine The Correlation and hence the relationship between the two variables considered.

Ans –There are 3 different types of correlation-

  • Positive Correlation
  • Negative Correlation
  • Zero Correlation


Crack IIT JEE with Unacademy

Get subscription and access unlimited live and recorded courses from India’s best educators

  • Structured syllabus
  • Daily live classes
  • Ask doubts
  • Tests & practice
Learn more

Notifications

Get all the important information related to the JEE Exam including the process of application, important calendar dates, eligibility criteria, exam centers etc.

Allotment of Examination Centre
JEE Advanced Eligibility Criteria
JEE Advanced Exam Dates
JEE Advanced Exam Pattern 2023
JEE Advanced Syllabus
JEE Application Fee
JEE Application Process
JEE Eligibility Criteria 2023
JEE Exam Language and Centres
JEE Exam Pattern – Check JEE Paper Pattern 2024
JEE Examination Scheme
JEE Main 2024 Admit Card (OUT) – Steps to Download Session 1 Hall Ticket
JEE Main Application Form
JEE Main Eligibility Criteria 2024
JEE Main Exam Dates
JEE Main Exam Pattern
JEE Main Highlights
JEE Main Paper Analysis
JEE Main Question Paper with Solutions and Answer Keys
JEE Main Result 2022 (Out)
JEE Main Revised Dates
JEE Marking Scheme
JEE Preparation Books 2024 – JEE Best Books (Mains and Advanced)
Online Applications for JEE (Main)-2022 Session 2
Reserved Seats
See all

Related articles

Learn more topics related to Mathematics
Zero Vector

A zero vector is defined as a line segment coincident with its beginning and ending points. Primary Keyword: Zero Vector

ZERO MATRIX

In this article, we will discuss about the zero matrix and it’s properties.

YARDS TO FEET

In this article we will discuss the conversion of yards into feet and feets to yard.

XVI Roman Numeral

In this article we are going to discuss XVI Roman Numerals and its origin.

See all
Access more than

10,505+ courses for IIT JEE

Get subscription

Trending Topics

  • JEE Main 2024
  • JEE Main Rank Predictor 2024
  • JEE Main Mock Test 2024
  • JEE Main 2024 Admit Card
  • JEE Advanced Syllabus
  • JEE Preparation Books
  • JEE Notes
  • JEE Advanced Toppers
  • JEE Advanced 2022 Question Paper
  • JEE Advanced 2022 Answer Key
  • JEE Main Question Paper
  • JEE Main Answer key 2022
  • JEE Main Paper Analysis 2022
  • JEE Main Result
  • JEE Exam Pattern
  • JEE Main Eligibility
  • JEE College predictor
combat_iitjee

Related links

  • JEE Study Materials
  • CNG Full Form
  • Dimensional Formula of Pressure
  • Reimer Tiemann Reaction
  • Vector Triple Product
  • Swarts Reaction
  • Focal length of Convex Lens
  • Root mean square velocities
  • Fehling’s solution
testseries_iitjee
Predict your JEE Rank
.
Company Logo

Unacademy is India’s largest online learning platform. Download our apps to start learning


Starting your preparation?

Call us and we will answer all your questions about learning on Unacademy

Call +91 8585858585

Company
About usShikshodayaCareers
we're hiring
BlogsPrivacy PolicyTerms and Conditions
Help & support
User GuidelinesSite MapRefund PolicyTakedown PolicyGrievance Redressal
Products
Learner appLearner appEducator appEducator appParent appParent app
Popular goals
IIT JEEUPSCSSCCSIR UGC NETNEET UG
Trending exams
GATECATCANTA UGC NETBank Exams
Study material
UPSC Study MaterialNEET UG Study MaterialCA Foundation Study MaterialJEE Study MaterialSSC Study Material

© 2025 Sorting Hat Technologies Pvt Ltd

Unacademy
  • Goals
    • AFCAT
    • AP EAMCET
    • Bank Exam
    • BPSC
    • CA Foundation
    • CAPF
    • CAT
    • CBSE Class 11
    • CBSE Class 12
    • CDS
    • CLAT
    • CSIR UGC
    • GATE
    • IIT JAM
    • JEE
    • Karnataka CET
    • Karnataka PSC
    • Kerala PSC
    • MHT CET
    • MPPSC
    • NDA
    • NEET PG
    • NEET UG
    • NTA UGC
    • Railway Exam
    • SSC
    • TS EAMCET
    • UPSC
    • WBPSC
    • CFA

Share via

COPY