Access free live classes and tests on the app
Download
+
Unacademy
  • Goals
    • AFCAT
    • AP EAMCET
    • Bank Exam
    • BPSC
    • CA Foundation
    • CAPF
    • CAT
    • CBSE Class 11
    • CBSE Class 12
    • CDS
    • CLAT
    • CSIR UGC
    • GATE
    • IIT JAM
    • JEE
    • Karnataka CET
    • Karnataka PSC
    • Kerala PSC
    • MHT CET
    • MPPSC
    • NDA
    • NEET PG
    • NEET UG
    • NTA UGC
    • Railway Exam
    • SSC
    • TS EAMCET
    • UPSC
    • WBPSC
    • CFA
Login Join for Free
avtar
  • ProfileProfile
  • Settings Settings
  • Refer your friendsRefer your friends
  • Sign outSign out
  • Terms & conditions
  • •
  • Privacy policy
  • About
  • •
  • Careers
  • •
  • Blog

© 2023 Sorting Hat Technologies Pvt Ltd

Watch Free Classes
    • Free courses
    • JEE Main 2024
    • JEE Main 2024 Live Paper Discussion
    • JEE Main Rank Predictor 2024
    • JEE Main College Predictor 2024
    • Stream Predictor
    • JEE Main 2024 Free Mock Test
    • Study Materials
    • Notifications
    • JEE Advanced Syllabus
    • JEE Books
    • JEE Main Question Paper
    • JEE Coaching
    • Downloads
    • JEE Notes & Lectures
    • JEE Daily Videos
    • Difference Between
    • Full Forms
    • Important Formulas
    • Exam Tips
JEE Main 2026 Preparation: Question Papers, Solutions, Mock Tests & Strategy Unacademy » JEE Study Material » Mathematics » Calculating Mean & Median

Calculating Mean & Median

The three statistical metrics, calculating mean, median, and mode, are frequently employed to encapsulate data sets. This study material focuses on calculating mean and median in detail.

Table of Content
  •  

Introduction 

The “mean” is essentially an “average” in which all of the numbers are added together and then divided by the number of digits. The “median” of a number series is the “middle” value, while the “mode” is the value that appears frequently. Out of these three measures, the mode formula in statistics opens up several ranges and elements for the student’s consideration. Let’s get to know more about how to calculate mean and median.

Calculating Mean and Median

The mean is the first theory to grasp from the mean, median, and mode calculator. As previously stated, it is the ratio of the total of all values to the number of items. Simple arithmetic mean and weighted arithmetic mean are the two forms of Mean. 
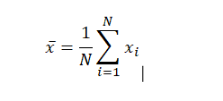
Mean Formula 

Mean is commonly represented as x, pronounced “x bar,” and the bar notation is a popular signal of some form of the mean even when the variable is not x. Instead of utilising the variable x, the Greek symbol mu, or, is used in the case of the population mean. In statistics, the sample mean is sometimes displayed with a capital X, which is confusing.

The mean in this context refers to a value in the middle of a discrete set of numbers, meaning the sum of all values in the data set divided by the total number of values. With minor differences in the variables employed, the equation for calculating the arithmetic mean is nearly identical to that for computing the statistical notions of population and sample mean:

The median is a value that divides a data sample, population, or probability distribution into two halves in statistics. Finding the median entails locating a value in a data sample physically located in the middle of the other numbers. 

It’s worth noting that the order of the data samples matters when computing the median of a finite list of numbers. The values are usually listed in ascending order, but there’s no reason why listing them in descending order would produce different results. The median is simply the number in the center of the list of all values when the total number of values in a data sample is odd.

For instance, in the data 

2,10,21,23,23,38,38

Following the ascending sequence of the data and determining that there is an odd number of variables, it is evident that 23 is the median in this situation. If the data set were to be supplemented with another value

Because there are an even number of values, the median will be the average of the two middle numbers, which in this case are 23 and 23, with a mean of 23. It’s worth noting that the inclusion of an outlier (a number that falls outside the expected range of values), the value 1,027,892, does not influence the data set in this case. If the mean for this data set is computed, the result is 128,505.875. This value does not represent the seven other values in the data set. 

The median is the mean of the two middle values when the data sample has an even number of values. While this may seem perplexing, keep in mind that while the median may involve the computation of a mean, it will only involve the two middle values in this case, whereas a mean will include all of the values in the data sample.

While both and other statistical values should be calculated when summarising data, if there are particularly wide fluctuations between values, the median can provide a better indication of a typical value in a given data collection.

Central Tendency

The terms “mean,” “median,” and “mode” all refer to measures of central tendency. The mean, median, and mode calculator denote a data synopsis that depicts the dataset’s center point or quintessential value. These measures, often known as the central location of distribution, define where the majority of values in a distribution fall. 

Depending on the data, the best metrics of central tendency can be chosen. A “measure of central tendency” is a framework for evaluating a location parameter or a statistic for evaluating a location parameter.

Range

In statistics, the range of a data set is the difference between the greatest and lowest values. While the range has many meanings in different fields of statistics and mathematics, this is the most basic definition that the calculator uses. Using the example:  

2,10,21,23,23,38,38

38 – 2 = 36

In this case, the range is 36. Be it big or small numbers. It can considerably impact range. Continuing with the previous example,

2,10,21,23,23,38,38,1027892

In this scenario, the range would be 1,027,890, versus 36 in the prior case. As a result, it’s critical to examine data sets to account for outliers thoroughly. 

The basic arithmetic mean considers all data values equal and assigns equal weight to each one. Weighted arithmetic mean, on the other hand, assigns weights or emphasis to the values. 

Conclusion

Compared to the mean, the main benefit of utilizing the median is to describe statistical data. While both statistical values should be calculated when summarising data, when there are particularly wide fluctuations between values, the median can provide a better indication of a typical value in a given data collection. There are plenty of study materials on calculating the mean and median online.

faq

Frequently asked questions

Get answers to the most common queries related to the JEE Examination Preparation.

In discrete series, how to calculate a median?

Ans: To calculate the median in a discrete series, arrange the series of numbers in a descending or...Read full

What is the mean value?

Ans: Mean is the most common form of average. Divide the sum of all the observations by the number ...Read full

Define range

The range is the difference between the minimum and maximum values with continuous random variables. The difference ...Read full

Ans: To calculate the median in a discrete series, arrange the series of numbers in a descending or ascending order, calculate the increased frequencies and use the formula to calculate the median. The value of the median is the corresponding value of the variable. 

Ans: Mean is the most common form of average. Divide the sum of all the observations by the number of observations to find the value.

The range is the difference between the minimum and maximum values with continuous random variables. The difference between two extreme points on the distribution curve where the function’s value falls to 0 is known as range.

Crack IIT JEE with Unacademy

Get subscription and access unlimited live and recorded courses from India’s best educators

  • Structured syllabus
  • Daily live classes
  • Ask doubts
  • Tests & practice
Learn more

Notifications

Get all the important information related to the JEE Exam including the process of application, important calendar dates, eligibility criteria, exam centers etc.

Allotment of Examination Centre
JEE Advanced Eligibility Criteria
JEE Advanced Exam Dates
JEE Advanced Exam Pattern 2023
JEE Advanced Syllabus
JEE Application Fee
JEE Application Process
JEE Eligibility Criteria 2023
JEE Exam Language and Centres
JEE Exam Pattern – Check JEE Paper Pattern 2024
JEE Examination Scheme
JEE Main 2024 Admit Card (OUT) – Steps to Download Session 1 Hall Ticket
JEE Main Application Form
JEE Main Eligibility Criteria 2024
JEE Main Exam Dates
JEE Main Exam Pattern
JEE Main Highlights
JEE Main Paper Analysis
JEE Main Question Paper with Solutions and Answer Keys
JEE Main Result 2022 (Out)
JEE Main Revised Dates
JEE Marking Scheme
JEE Preparation Books 2024 – JEE Best Books (Mains and Advanced)
Online Applications for JEE (Main)-2022 Session 2
Reserved Seats
See all

Related articles

Learn more topics related to Mathematics
Zero Vector

A zero vector is defined as a line segment coincident with its beginning and ending points. Primary Keyword: Zero Vector

ZERO MATRIX

In this article, we will discuss about the zero matrix and it’s properties.

YARDS TO FEET

In this article we will discuss the conversion of yards into feet and feets to yard.

XVI Roman Numeral

In this article we are going to discuss XVI Roman Numerals and its origin.

See all
Access more than

10,505+ courses for IIT JEE

Get subscription

Trending Topics

  • JEE Main 2024
  • JEE Main Rank Predictor 2024
  • JEE Main Mock Test 2024
  • JEE Main 2024 Admit Card
  • JEE Advanced Syllabus
  • JEE Preparation Books
  • JEE Notes
  • JEE Advanced Toppers
  • JEE Advanced 2022 Question Paper
  • JEE Advanced 2022 Answer Key
  • JEE Main Question Paper
  • JEE Main Answer key 2022
  • JEE Main Paper Analysis 2022
  • JEE Main Result
  • JEE Exam Pattern
  • JEE Main Eligibility
  • JEE College predictor
combat_iitjee

Related links

  • JEE Study Materials
  • CNG Full Form
  • Dimensional Formula of Pressure
  • Reimer Tiemann Reaction
  • Vector Triple Product
  • Swarts Reaction
  • Focal length of Convex Lens
  • Root mean square velocities
  • Fehling’s solution
testseries_iitjee
Predict your JEE Rank
.
Company Logo

Unacademy is India’s largest online learning platform. Download our apps to start learning


Starting your preparation?

Call us and we will answer all your questions about learning on Unacademy

Call +91 8585858585

Company
About usShikshodayaCareers
we're hiring
BlogsPrivacy PolicyTerms and Conditions
Help & support
User GuidelinesSite MapRefund PolicyTakedown PolicyGrievance Redressal
Products
Learner appLearner appEducator appEducator appParent appParent app
Popular goals
IIT JEEUPSCSSCCSIR UGC NETNEET UG
Trending exams
GATECATCANTA UGC NETBank Exams
Study material
UPSC Study MaterialNEET UG Study MaterialCA Foundation Study MaterialJEE Study MaterialSSC Study Material

© 2026 Sorting Hat Technologies Pvt Ltd

Unacademy
  • Goals
    • AFCAT
    • AP EAMCET
    • Bank Exam
    • BPSC
    • CA Foundation
    • CAPF
    • CAT
    • CBSE Class 11
    • CBSE Class 12
    • CDS
    • CLAT
    • CSIR UGC
    • GATE
    • IIT JAM
    • JEE
    • Karnataka CET
    • Karnataka PSC
    • Kerala PSC
    • MHT CET
    • MPPSC
    • NDA
    • NEET PG
    • NEET UG
    • NTA UGC
    • Railway Exam
    • SSC
    • TS EAMCET
    • UPSC
    • WBPSC
    • CFA

Share via

COPY