 Profile
 Settings
 Refer your friends
 Sign out


The positive square root of the variance is the standard deviation. One of the fundamental techniques in statistical analysis is standard deviation. Standard deviation, also known as SD or indicated by the symbol ‘σ’ indicates how far a value deviates from the mean value. A low standard deviation indicates that the values are often within a few standard deviations of the mean, whereas a large standard deviation indicates that the values are much outside of the mean.
The square root of the variance of a random variable, sample, statistical population, data collection, or probability distribution represents its standard deviation. The average absolute deviation is more robust in theory but less so in practice. The standard deviation’s useful virtue is that, unlike the variance, it is expressed in the same unit as the data.
In this article we will learn how to determine a random variable’s standard deviation as well as the standard deviation of data that has been grouped and ungrouped.
Standard Deviation
The standard deviation is a statistic that expresses how much variance or dispersion there is in a group of numbers. While a high standard deviation implies that the values are dispersed over a wider range, a low standard deviation shows that the values tend to be close to the mean of the collection.
Calculating Standard Deviation: Steps to Take
1. The arithmetic mean of the observations is the mean; ascertain it.
2. Calculate the squared deviations from the mean. (the data value-mean) 2
3. Calculate the squared differences’ average.
(Variance = total squared differences + total observations)
4. Calculate the variance’s square root. (Standard deviation = √Variance)
Formula for Standard Deviation
The standard deviation calculates the variance of statistical data. The method of determining the deviation of data points is used to calculate the degree of dispersion.
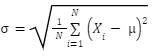
Where
σ denotes standard deviation population
μ denotes assume mean
How to Find the Standard Deviation for Grouped and Ungrouped Data?
For various sets of data, different standard deviation calculations are used. Data’s divergence from the mean or average location is measured by the distribution. The standard deviation can be discovered using one of two methods.
- Actual mean method
- Assumed mean method
Actual mean method
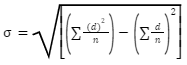
Assumed mean method
When the x values are big, the mean is determined by selecting an arbitrary value (A). The formula for the divergence from this supposed mean is d = x – A.
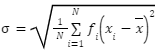
How to Interpret the Standard Deviation of Grouped Data?
For,
n number of observations x1,x2….xn
Frequency f1,f2,f3fn then standard deviation is
Conclusion
In this article we learned that to discover how estimates for a group of observations are dispersed from the mean, utilize the standard deviation. Each of them serves a distinct role. While the variance is typically considerably more valuable theoretically, the standard deviation is typically more beneficial to describe the variability of the data. For instance, the variance of the sum of the uncorrelated distributions equals the total of the variances of the distributions. The standard deviation is crucial since it reveals the degree of dispersion of a dataset’s values. We are looking for the following metrics whenever we evaluate a dataset: the dataset’s centre. The mean and median are the two metrics that are most frequently used to measure the “centre.”


