Profile
 Settings
 Refer your friends
 Sign out


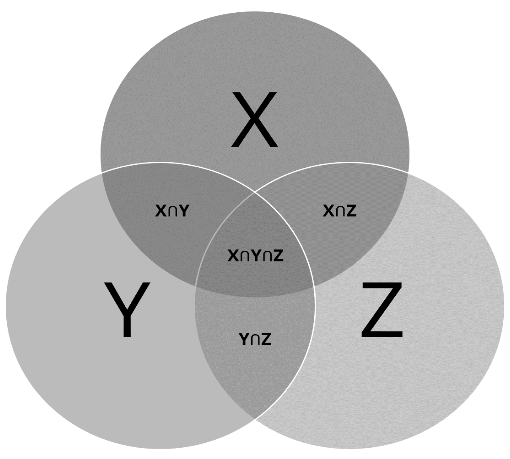
Multiple overlapping shapes (typically circles) depict sets of various elements in a Venn diagram. Its goal is to create a graphical representation of elements that highlights their similarities and distinctions.
They’re mostly used in set theory, but they’re also used to show links between items in fields including statistics, logic, probability, linguistics, commerce, and computer science. A Venn diagram like the one above depicts three groups of items called X, Y, and Z, as well as the relationships between them. Venn diagrams are often used in presentations, commercial and scientific reports, and give a strong visual depiction of data. They are similar to Euler diagrams, with the exception that they do not depict a set if no elements are present.
Symbols for Venn Diagrams
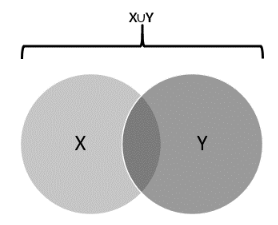
Union (U): Represents the union of all sets — that is, the universe of all elements contained within the X and Y sets.
Symbol for Intersection
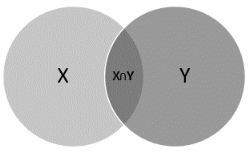
All components shared or common within the selected sets or groupings are represented by the intersection . Within sets X and Y, intersection signifies shared components (in the middle).
Complement (XC): Represents anything that isn’t in a set; in this case, everything that isn’t in set X. The complement of X is represented by the equation XC = U/A, where U denotes a universe of elements. The diagram below depicts the absolute complement of X in U – that is, everything except X in the universe (grey area).

Venn Diagrams Have a Long History
John Venn, a British mathematician and logician, created the Venn diagram concept. It first appeared in his journal “On the Diagrammatic and Mechanical Representation of Propositions and Reasonings” in 1980. Venn diagrams, on the other hand, can be dated back to the 1200s, when philosopher and logician Ramon Llull created comparable diagrams.
Other logicians developed diagrams that resemble Venn diagrams, but the closest diagrams that approach Venn diagrams were drawn by Leonard Euler in the 1700s. He created what he called Euler diagrams. In his diagrams, which he first labelled as Euler circles, John Venn mentioned Euler.
Clarence Irvine Lewis coined the name Venn diagram in his 1918 book “A Survey of Symbolic Logic.” In the 19th and 20th centuries, mathematicians and logicians improved the diagrams to depict clearer and more intricate relationships utilising additional sets. Venn diagrams have been used in a variety of areas and difficulties, thanks to advances in technology and computer use.
Venn Diagrams Have Many Advantages
Venn diagrams aid in the visual representation of knowledge, allowing students and professionals to comprehend the reasoning underlying the correlations between various aspects.
Venn diagrams aid in decision-making when there are two or more options to consider. It makes comparing and contrasting easy. As a result, using Venn diagrams for assessment tends to spark conversation and provide information about participants’ thinking, which helps in decision-making.
Venn diagrams can help you reason through complex issues using logic. Mathematical difficulties can be easily simplified to a format that is straightforward and accessible.
Detect data patterns: It is easier to spot data patterns that were previously undetectable. Probabilities and correlations are easily determined patterns.
Venn Diagram Application Areas
Set theory is an area of mathematics that deals with set ideas including unions, intersections, and complements. It deals with large, complicated problems that are solved via Venn diagrams.
Venn diagrams are used in logic to examine the validity of various arguments and conclusions. Deductive reasoning is also used. They come in handy when using logic statements like if/then, all/some/no, and may be.
Venn diagrams are employed in the study of statistics and probability, which is concerned with forecasting the chance of an event occurring. They are inextricably tied to predictive modelling.
Venn diagrams are also utilised in the teaching profession to aid students’ reading comprehension, particularly in the lower grades. Students are better able to grasp topics and articulate the similarities and contrasts between the taught aspects.
Venn diagrams are often used in linguistics to depict links between different languages. Language evolution allows commonalities and differences across languages that arose from a common mother tongue to emerge through time.
Venn diagrams are used in a variety of ways in the business world. In presentations to customers, investors, and suppliers, many financial analysts and economists use Venn diagrams. They can be used to depict linkages between products, processes, SBUs, concepts, and a variety of other items.
Visualizing programming languages and structures is how computer science is applied.
CONCLUSION
They’re also a sort of diagram known as an Euler diagram. The main distinction is that with Euler diagrams, the circles representing your data do not have to overlap. Venn diagrams can have numerous intersections and circle sets, but the 3-circle or triple Venn diagram is the most common. The fact that the triple Venn forms a curved triangle of perfect and constant width at its centre, known as the “Reuleaux triangle,” is one of the reasons for its popularity.