Profile
 Settings
 Refer your friends
 Sign out


Kinematics is the study of how to describe the motion of objects using words, pictures, figures, graphs, and equations. Kinematics is a branch of mechanics that studies movement. Any kinematics study aims to develop complex mental models that can be used to describe (and eventually explain) real-world object motion.
Graphical Representation of Motion:
- For understanding the object position, we use line graphs
- Line graphs basically depend on the distance of the object, its velocity (or you can say speed), and the time it covers to change its position.
Let’s first see the distance-time graph
The distance-Time Graphs tell you that, at what time an object is located. The slope of the graph will tell you about the speed of the object.
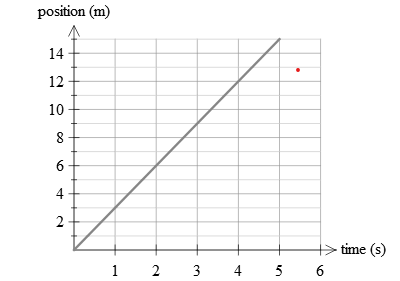
It is a graph where instantaneous position x of a particle is plotted on the y-axis and the time t on the x-axis as shown below in the figure:
The X-axis represents the object’s distance, and the y-axis represents the time taken by the object to cover that distance.
As you can see in the graph, an object moving at constant velocity(or you can say speed)
The distance traveled by the object is inverse(or you can say directly proportional) to the time taken.
Thus, in the graph you observe, distance against time is a straight line (Fig. 8.1).

Fig.8.1: Distance-time graph of an object moving with uniform speed

Fig.8.2: Distance-time graph for an object moving with non-uniform speed
When an object is moving at non-constant speed (distance is continuously varying with time):
You can see that the distance along with time varies.
The graph shows a non-linear variation of the distance with respect to time (Fig. 8.2).
Velocity-Time graphs: In this graph, time is represented along the x-axis, and Velocity is represented along the y-axis.
When an object is moving at continuous velocity (or you can say speed).
As you can observe that the velocity does not vary with time.
You can see the graph is going straight and parallel to the x-axis (Fig. 8.3).


Fig – 8.4 Fig – 8.5
For the uniformly accelerated motion: The velocity-time graph, as seen above its going straight (Fig. 8.4)
For the non-uniformly accelerated motion, the velocity-time graph is observed in a uniform shape (Fig. 8.5).
velocity time graph
The information about the journey taken by an object is given by Velocity-time graphs.
On a velocity-time graph
On y axis velocity is plotted
On x axis the time is plotted
The distance travelled by the object and the acceleration of an object can also be calculated by A velocity-time graph.
Imagine a situation that on a straight track the sprinter is just taking off from the starting blocks for running a short race. For the first few seconds of the race, the sprinter will pick up more speed as she starts with a burst of speed. After that she keeps running at her top speed until he finishes the race by crossing the finish line. After that she will slow down. Acceleration is defined as change in velocity. In this case though her direction stays the same but her speed is changing so it means she has an acceleration as velocity is a measure of both direction and speed.
A velocity-time graph can represent the changing in velocity not of the sprinter but for all the other moving objects(any kind of object). In a figure given below , a velocity time graph of the sprinter is showing how it’s velocity changes over time. The magnitude of velocity of the sprinter first increases for the first 4 seconds, after that it remains constant for the next 3 seconds and finally it decreases for the last 3 seconds after she crosses the finish line.
Slope of line of velocity time graph represents the acceleration of object. This graph has 3 stages
Equations of Motion by Graphical System
When an object moves along a straight line with continuously changing acceleration, it’s possible to relate its velocity(or you can say speed), acceleration while changing its position, and the distance covered by it in a particular time that is described by three given equations as you can see below-
For convenience, a set of three similar equations of motion are given below:
v = u+at
s = ut + 1/2at2
2as = v2 – u2
Then u is the object’s original velocity, which moves with uniform acceleration a for time t, v is the final velocity, and s is the distance traveled by the object in time t.
Conclusion :
1. According to the principle, the slope of a line on a position-time graph provides useful information about an object’s velocity.
2. If the velocity is changing then the slope is changing.
3. If velocity is positive then the slope is positive.
4. Slope of the velocity time graph gives acceleration.
5. Slope of the position time graph gives velocity.
6. Area under the velocity time graph gives displacement.
7. Area under the position time graph gives nothing.