 Profile
 Settings
 Refer your friends
 Sign out


The atomic hydrogen emission spectrum has been separated into a variety of spectral series, with wavelengths calculated using the Rydberg formula. Electrons in an atom transition between two energy levels, resulting in these spectral lines. Because it classified the series, the Rydberg formula was fundamental in the development of quantum mechanics. Spectral series are used in astronomical spectroscopy to assess the existence of hydrogen and calculate red shifts.
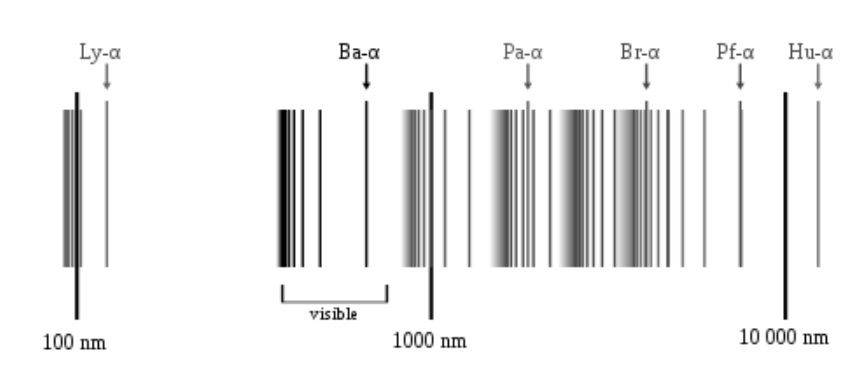
Fig: the spectral series of hydrogen, on a logarithmic scale
The hydrogen atom is the most basic atomic system found in nature, it produces the most basic series. Each component of the light or radiation generates an image of the source when a slit permits a beam of light or other radiation to enter the device. These images can be observed under the spectroscope when they are resolved. Parallel lines with constant spacing will be positioned next to each other in the photos. The lines will be farther apart on the higher wavelength side and gradually closer in the lower wavelength side as you move from one wavelength to the next. The series limit is defined as the smallest wavelength with the fewest separated spectral lines.
Rydberg formula
Atomic hydrogen has a visible emission spectrum. Several different spectral series make up this spectrum. After being excited, the electrons in the gas make energy changes. The model of electron transitions between energy levels developed by Neils Bohr produced these spectral lines. Using Rydberg’s formula, the wavelengths of the spectral series are computed. The Rydberg formula represents the energy differential between the various levels of Bohr’s model and the wavelengths of absorbed or emitted photons. It can be expressed numerically as follows: –
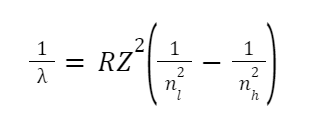
Where,
- 𝜆 = wavelength
- R = Rydberg constant has the value 1.09737×10⁷ m-1
- Z = Atomic no.
- ni = the lower energy level
- nh= the higher energy level
This equation holds true for Hydrogen and Hydrogen-related elements. Only when nh > nl does the equation produce a significant result. The Rydberg formula is important in the development of quantum mechanics because it allows series to be classified. In astronomical spectroscopy, they are also important ideas. Particularly useful for detecting hydrogen and calculating red shift.
How spectral series are formed
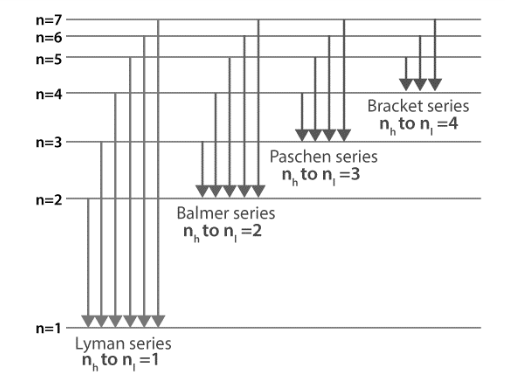
Fig: Electron transitions inside a hydrogen atom
The set of energy levels/states that each atom encloses is modelled and well explained by Bohr’s atomic model. Energy states are designated by quantum numbers (n=1,2,3,4,5,6,…..). When electrons jump from higher energy levels (nh) to lower energy states (nl), a photon of energy nh – nl is released (nl). Because the energy associated with each state is constant, the difference between them is constant as well, resulting in a transition between states with similar energies that produces the same energy photon.
The spectral series is divided into analogous series when an electron transitions to a lower energy level. The Greek alphabets are used to differentiate the spectral lines of corresponding energy in the series. Hydrogen has the following spectral series:
Lyman series
Between 1906 and 1914, Theodore Lyman founded the series. The result is named after him. Lyman series emerges when electrons transition from higher energy states (nh=2,3,4,5,6,…) to nl=1 energy state, according to Bohr’s model. The Lyman series’ wavelengths are all in the ultraviolet region.
Balmer series
Johann Balmer first found the series in the year 1885. As A result, the series is named after him.
When electrons go from a higher energy level to a lower energy level (nh=3,4,5,6,7,…)to the lower energy state (nl=2), the Balmer series appears. The wavelengths of the Balmer series are all visible in the electromagnetic spectrum (400 nm to 740nm). In astronomy, the Balmer series’ H-Alpha line, which is also a part of the solar spectrum, is used to detect hydrogen.
Paschen series
In 1908, a German physicist named Friedrich Paschen was the first to notice the series. As A result, the series is named after him. The Paschen series develops when electrons migrate from higher energy levels (nh=4,5,6,7,8,…) to states with a lower energy (nl=3). The wavelengths of the Paschen series are all in the infrared range.
The Brackett series and the Paschen series, which has the shortest wavelength, are overlapping.
Brackett series
In the year 1922, an American physicist named Friedrich Sumner Brackett spotted the series for the first time. As A result, the series bears his name. When electrons migrate from higher energy levels (nh=5,6,7,8,9…) to lower energy states (nl=4), the Brackett series emerges. The Brackett series’ wavelengths are all in the infrared range of the electromagnetic spectrum.
Pfund series
In 1924, August Harman Pfund became aware of the series for the first time. As A result, the series is named after him. The Pfund series develops when an electron goes from a higher energy state (nh=6,7,8,9,10,…) to a lower energy level (nl=5). The Pfund series’ wavelengths are all in the infrared range of the electromagnetic spectrum.
Humphreys series
Curtis J Humphreys, an American physicist, noticed the series for the first time in 1953, and the series is named after him. The Humphreys series develops when electrons migrate from higher energy levels (nh=7,8,9,10,11…) to a lower energy state (nl=6). Humphreys series wavelengths are all in the infrared portion of the electromagnetic spectrum.
Further
They’re the nameless series that follow the Rydberg equation’s spectral pattern. Peter Hanson and John Strong discovered them in the infrared spectrum during an experiment in 1972. When electrons transition from higher energy levels (nh=8,9,10,11…) to nl=7 or higher energy states, these series appear. The series can be seen at longer wavelengths. The spectral lines are quite faint and spread out over a large area. They are associated with extremely rare atomic occurrences.
Conclusion
The nucleus of a hydrogen atom has an electron orbiting it. The electromagnetic interaction that exists between the electron and the nuclear proton causes the electron to exist in a series of quantum states, each with its own energy. The Bohr model of the hydrogen atom depicted these states as separate orbits around the nucleus. As indicated in the diagram, each energy level, or electron shell, or orbit, is designated by an integer, n. The Bohr model was later superseded by quantum mechanics, in which the electron occupies an atomic orbital rather than an orbit, but the hydrogen atom’s allowable energy levels remained the same.
