 Profile
 Settings
 Refer your friends
 Sign out


Descriptive statistics measure the deviation from the mean of data points and the spatial variation. This is the square root of a sample’s variance or the standard derivation of a random variable, statistical population, probability distribution or data set.
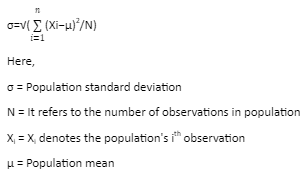
Based on n observations, where the observations are
mean deviation is calculated as:
As a result, the sum of squares of deviations from the mean does not seem like an appropriate measurement of dispersion. If the average squared differences from the mean are small, it indicates that the observations xi are close to the mean ¯x.
How to determine the standard deviation?
- The median can be found by using the mean or the average.
- Using the squared differences from the mean, find the differences squared (The data value – mean)2.
- Add the squared differences together and find the average (Variance = The sum of squared differences ÷ the number of observations).
- Take the square root of the variance (Standard deviation = √Variance).
Standard Deviation Formula & Standard Deviation Calculator
Standard deviation is the measure of the spread of statistical data. It is used to estimate the deviation of data points and compute the degree of dispersion. Standard deviation describes the variation around the mean. We can calculate the standard deviation of sample data by using a standard deviation formula.
Variance & SD Formula
The formula for the standard deviation is as follows:
Standard Deviation of Random Variables in Probability Distribution
When considering the probability distribution of a random variable, the spread determines how much the value deviates from the expected value. Each outcome in a sample space is given a numerical value using this function. In this case, it is represented by X, Y, or Z, as it is a function. To calculate the standard deviation for a random variable, x, you take the square root of the product of the variance between the random variable, x, and the expected value E(x) and the probability of the variable.
Standard Deviation of Probability Distribution
Many trials make up the experimental probability. We tend to know the average outcome if the difference between a theoretical probability and its relative frequency gets closer to one another. As a result of the experiment, the mean is termed the expected value of the experiment as 𝜇.
The mean and standard deviation in a normal distribution are zero and 1, respectively. As a random variable, the number of successes is deterministic in a binomial experiment. Whenever a random variable has a binomial distribution, its standard deviation is given by: 𝜎= √(npq), where mean: 𝜇 = np; n = number of trials; p = probability of success; and 1-p =q is the probability of failure.
In a Poisson distribution, the standard deviation is given by 𝜎= √λt, where λ is the average number of successes in an interval of time t.
Variance
In layman’s terms, variance is a measure of how far a set of data is from its mean or average. It is denoted as ‘σ2’.
Properties of Variance
Whenever probability or statistics are studied, the result can only be positive because every term of the variance sum is squared, and the result can only be positive or zero.
Whenever a variance is measured, it is squared. Let’s take a set of weights in kilograms as an example where variance is given as kilograms square. Neither the mean nor the data can be directly compared with the population variance since variance is squared.
Conclusion
The standard deviation measures the variation around a mean in a data set. It can be used to analyze data with the same mean but a different range. The standard deviation can be calculated using the square root of the variance to compare how far apart a group of numbers is from the mean. The difference between each data point and the average of all data points measures the level of variation between those points. Having a low standard deviation means that the values tend to converge towards the mean. As a result, a high standard deviation indicates a wide variation between values.


