 Profile
 Settings
 Refer your friends
 Sign out


A clear depiction of the energy level diagram is important to understand the various states and transitions of energy in an atom or molecule. The hydrogen atom is a good example to start with in order to gain a fundamental understanding of energy level diagrams. In this blog post, we will take a closer look at the energy level diagram of the hydrogen atom and explore how it helps us understand atomic structure and bonding. Stay tuned for more!
What is an energy level diagram?
An energy level diagram, or energy band diagram, is a graphical representation of the allowed energy states of a system. The most common type of energy level diagram is the molecular orbital energy level diagram. This type of diagram shows the energies of the orbitals in a molecule. The molecular orbitals are shown as horizontal lines, and the energies are shown as vertical lines.
The energy level diagram has two lines. The blue line represents the ground state energy, and the red line represents the excited state energy. The horizontal axis represents the orbital energy, and the vertical axis represents the total energy of the system.
Understanding Energy Level Diagram:
To understand the light emitted by atoms, we need to understand energy level diagrams. In an energy level diagram, the horizontal axis represents the energy of an electron and the vertical axis represents the number of electrons present at that energy. The most important feature of an energy level diagram is the line between two energies called an “energy transition.”
Energy transitions correspond to photons being emitted or absorbed by an atom. The energy of a photon is equal to the difference in energy between the two energy levels involved in the transition.
The energies of photons emitted by an atom are always quantized, which means they can only have certain values. The possible values an electron can have for any given energy level are also quantized.
Representation of energy level diagrams:
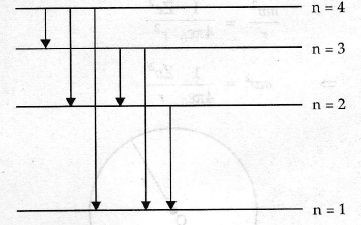
Energy level diagrams are the pictorial representations of energy levels of electrons in an atom or molecule. In other words, energy level diagrams depict the energies of molecular orbitals (MOs) in a molecule. Energy level diagrams can be drawn for molecules as well as for atoms. The simplest example for an energy level diagram is that of a hydrogen atom that has only one electron. The energy level diagram of a hydrogen atom is as follows:
The energy levels are shown as horizontal lines and the orbitals are shown as arrows. The energy level diagram of the hydrogen atom clearly shows that the ground state energy level (E0) is lower than the first excited state energy level (E). This is because, in the ground state, the electron is in the lowest energy orbital (i.e. the orbital with the least energy). When the electron is excited to the next energy level, it goes to an orbital with higher energy. Thus, when an electron is in its ground state, it has lower energy than when it is in its excited state.
The energy level diagram of a hydrogen atom can be used to explain the emission and absorption of light by atoms. When an electron is excited from its ground state to a higher energy level, it absorbs light of a particular wavelength. This is because the energy required to excite the electron from its ground state to the first excited state is equal to the energy of the photon with that particular wavelength. Similarly, when an electron falls from higher energy to a lower level of energy level, it emits light of a particular wavelength. This is because the energy released when the electron falls from a higher level of energy to a lower energy level is equal to the energy of the photon with that particular wavelength.
Conclusion:
To sum it up, the energy level diagram of hydrogen is essential to understanding the atom. It gives a clear depiction of where the electron is likely to be found and how much energy it has. Additionally, it is useful for predicting the behaviour of other atoms and molecules. Therefore, anyone who wants to learn about atomic structure should start by studying the energy level diagram of hydrogen. Do you have any questions about the energy level diagram of hydrogen? Let us know in the comments!


