 Profile
 Settings
 Refer your friends
 Sign out


Velocity-time graph is a graph used to describe the relationship between the distance travelled by an object and the time it takes for it to travel that distance. It helps understand the motion of the object. The slope of this graph also helps calculate the acceleration of the motion. We can find both average and instantaneous acceleration using this graph, which will be discussed in the topics. The main advantage of the graph is that it is very easy to understand and interpret, and it allows us to see the relationship between two quantities.
Velocity-time graph
Velocity-time graph is one of the most widely used graph types in mathematics, economics and statistics. It is defined as a graph of the time evolution of a quantity over time. It is a collection of numbers or points plotted on a graph. These graphs have the property that any two points on the graph are linearly correlated. In these graphs, the velocity is taken on the y-axis since it is a dependent variable. In contrast, the time is taken on the x-axis since it is an independent variable. These graphs represent the velocity of an object after regular intervals or at a particular instant.
Types
There are two basic types of velocity-time graphs. One is for motion with constant velocity, and the other is for the motion with variable velocity. For example, suppose a car covers equal distances in fixed time intervals. In that case, it is said to have a constant velocity, whereas if the speed of its motion increases or decreases, it is said to have variable velocity. Both the cases have been discussed below in detail.
Slope
The slope of the velocity-time graph represents the acceleration of an object in motion. The positively inclined slope implies that the object is moving with positive acceleration. The negatively inclined slope indicates that the object moves with a negative acceleration or retardation. The constant slope (horizontal line) reveals that the motion is not accelerated (zero acceleration), and the object is moving with a constant velocity. The slope of the graph at a particular instant gives the acceleration of the motion at that time.
Velocity Observations
In the graph, if the plot lies above the x-axis, the velocity is positive, and if it lies below the y-axis, the velocity is negative. Suppose the line cuts the x-axis while being partially present above the x-axis and partially below the x-axis. It represents that the object had changed its direction of motion, which eventually changed the direction of the velocity. Suppose the line of the graph is moving away from the x-axis. In that case, it represents that the magnitude of the velocity (speed) increases, whereas if it is getting closer to the x-axis, the magnitude of velocity decreases.
Cases
When we draw a velocity-time graph, we use three cases.
Case 1: With constant velocity or zero acceleration
Velocity-time graphs with constant velocity show the spatial and temporal patterns of velocity and time. This type of graph helps understand the patterns of motion in the physical world. These graphs were designed to show the velocity distribution of the particles in the fluid. They are, however, valuable tools for in-depth analysis of the fluid flow. These graphs can also approximate the flow by solving the continuity equation and using the velocity magnitude to find the maximum velocity.

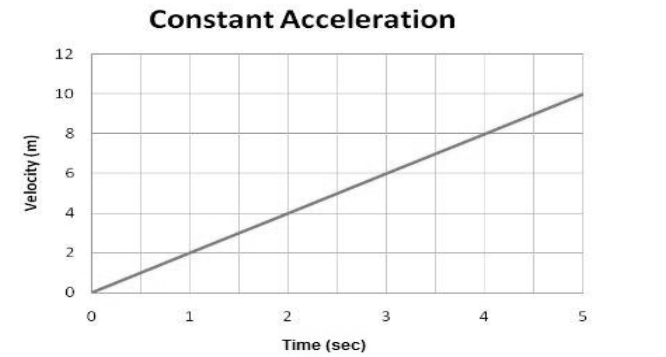
Case 2: With constant acceleration
When the acceleration in the velocity-time graph is constant, the particle’s speed at an initial instant is zero. The object’s velocity will increase linearly, as we see in the given equation below.
v = u + at
Here, u = 0
v = at
Example: Let us suppose the object has an acceleration of zero and a constant velocity at 10 m/s at t = 0. Then, throughout the time, it will remain constant.
Case 3: With increasing acceleration
Here, the graph is predicted to be a curve as the acceleration increases with time.
v = u + at
Here u = 0
V = at
As we know, acceleration is a function of time. Thus, the velocity-time graph will be a curve.

Conclusion
Velocity-time graph is one of the most widely used graph types in mathematics, economics and statistics. Two basic velocity-time graphs are motion with constant velocity and motion with variable velocity. The positively inclined slope implies that the object is moving with positive acceleration. The negatively inclined slope implies that the object moves with a negative acceleration or retardation. The constant slope implies that the motion is not accelerated and that the object is moving with a constant velocity.
