 Profile
 Settings
 Refer your friends
 Sign out


A trigonometric function is a part of mathematics that helps calculate functions that give a relationship between a triangle’s side and angle. For example, functions like Sine(sin), Cosine(cos), Tangent(tan), Cotangent(cot), Secant(sec), and Cosecant (cosec) help you to give a correlation between the sides and angle of a triangle. Along with that, a trigonometric ratio can also prove helpful in finding the missing parts of the triangle, which can include different sides and angles.
Trigonometric functions are one of the most important topics in which learning graphical representation is as vital as learning the theory. It is because many of the theoretical formulas are dependent on Graphical properties. For example, as per the definition of trigonometry ratios, each value of a graph differs from the other in many ways, like trigonometrical value, sign property, formulas and functions.
Based on the area of functions, a trigonometric graph can be plotted so that the X-axis contains the angle of the triangle and the vertical moving line, i.e. Y-axis contains the value of the trigonometric ratio for the respective function. To catch a strong grip on the graphical representation, continue reading as we move ahead in our study material notes on graphs of trigonometric functions.
Concept Of Trigonometry In Quadrants
Quadrants are the sections created after dividing a graph into four parts.
- If the angle is acute, i.e. less than 90° (θ < 90°), it lies in the first quadrant with both the coordinates, i.e. X and Y being positive.
- If the angle is obtuse, it is considered in the second quadrant, with the Y coordinate being positive and the X-coordinate being negative.
- If the angle is more than 180° and less than 270°, then the ratio lies in the third quadrant with both the axes coordinates being negative.
- Finally, if the coordinate lies in the fourth quadrant, which is only possible if the angle is more than 270° and less than 360°, then the x-coordinate is considered positive and Y-coordinate as negative.
The relationships between the ratios and quadrants could be seen in the graph, with the first quadrant being positive for all trigonometric ratios and the second being positive for only sin and cosec and negative for the rest of the ratios. Similarly, in the third quadrant, the gates of being positive are only open for tangent(tan) and cotangent(cot) trigonometric values and make the other remaining ratios lying in this quadrant appear with a negative sign. Finally, in the fourth quadrant, cos and sec can be only positive and make other ratios negative.
Graph of Trigonometric Functions
1.Sine Graph

In this graph, the function is considered as y=sin x. As you can see, the graph meets the X-axis only at the angles of 180° and 360°, multiples of π. It means that the graph of sin x passes through the X-axis with the value as sin x =0. Hence the period of the sine function is said to be 2π. Also, as you can see, the maximum value of the graph is at π/2, which is one, and the minimum value is -1 at (3π/2).
2.Cosine Graph
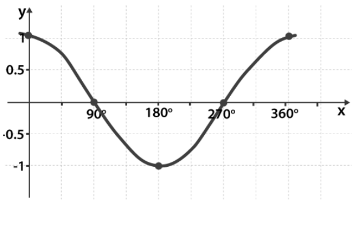
In this graph, the function is considered as y=sin x. As you can see, the graph meets the X-axis only at the angles of 180° and 360°, multiples of π. It means that the graph of cos x passes through the X-axis with the value as cos x =1. Hence the period of the cos function is said to be 2π. Also, as you can see, the maximum value of the graph is at π,4π, which is one, and the minimum value is -1 at (2π).
3.Tangent Graph

The tan function is different from sin and cos. It is the only function that goes between positive and negative infinity, crossing through the x-axis over the intervals of 180°. As a result, the amplitude of a tangent graph is undefined as the curves on the graph go to infinity.
4.The similarity between sin and cos graphs
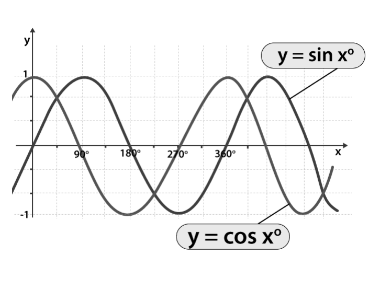
Most of the properties in sin and cos are similar to each other. But due to the difference
in angles, they become varying. Here are some similarities which we see between sin and cos.
- Both of these trigonometric ratios have the curve meeting along the X-axis only.
- They both have an amplitude of 1 and a minimum value of -1.
- They have possessed the same period, 360° or 2π radians.
Steps to Draw a Graph of Trigonometric Function
While drawing a sine function graph, convert the given function to the general form using the formula,
sin (bx – c) + d
This is used to find the different parameters such as, |a| = Amplitude, c/b = Phase shift, d = Vertical shift, 2π/|b| = Period.
The same case is used for the cosine function using the formula:
cos (bx – c) + d
Graphical representations of sin(x), cos(x), tan(x), csc(x), sec(x), cot(x):

Conclusion
The concept of graphs of trigonometric functions is very crucial to learn. It helps solve any mathematical idea with ease and at a faster pace. Also, graphs of trigonometry could be a valuable tool to simplify the problem and make its solving process more efficient.
Therefore, these graphs of trigonometric functions study material provided above could help you understand the topic more quickly and efficiently. Furthermore, studying all issues from the study material notes on graphs of trigonometric functions can help you achieve the milestone of tackling challenging problems in mathematics.
