Access free live classes and tests on the app
Download
+
Unacademy's Blog!
Login Join for Free
avtar
  • ProfileProfile
  • Settings Settings
  • Refer your friendsRefer your friends
  • Sign outSign out
  • Terms & conditions
  • •
  • Privacy policy
  • About
  • •
  • Careers
  • •
  • Blog

© 2023 Sorting Hat Technologies Pvt Ltd

[wp_login_wall media_id="448945" text_before_login="Download JEE Maths Formulas" text_after_login="Download JEE Maths Formulas"]

Trending Topics

  • JEE Main 2024
  • JEE Main Rank Predictor 2024
  • JEE Main Mock Test 2024
  • JEE Main 2024 Admit Card
  • JEE Advanced Syllabus
  • JEE Preparation Books
  • JEE Notes
  • JEE Advanced Toppers
  • JEE Advanced 2022 Question Paper
  • JEE Advanced 2022 Answer Key
  • JEE Main Question Paper
  • JEE Main Answer key 2022
  • JEE Main Paper Analysis 2022
  • JEE Main Result
  • JEE Exam Pattern
  • JEE Main Eligibility
  • JEE College predictor
[wp_login_wall media_id="424566" text_before_login=" Download Previous Year Papers" text_after_login="Download Previous Year Papers"] combat_iitjee

Related links

  • JEE Study Materials
  • CNG Full Form
  • Dimensional Formula of Pressure
  • Reimer Tiemann Reaction
  • Vector Triple Product
  • Swarts Reaction
  • Focal length of Convex Lens
  • Root mean square velocities
  • Fehling’s solution
testseries_iitjee Predict your JEE Rank .
JEE Main 2026 Preparation: Question Papers, Solutions, Mock Tests & Strategy Unacademy » JEE Study Material » Mathematics » Chi Square Test
[wp_login_wall media_id="448945" text_before_login="Download JEE Maths Formulas" text_after_login="Download JEE Maths Formulas"]

Trending Topics

  • JEE Main 2024
  • JEE Main Rank Predictor 2024
  • JEE Main Mock Test 2024
  • JEE Main 2024 Admit Card
  • JEE Advanced Syllabus
  • JEE Preparation Books
  • JEE Notes
  • JEE Advanced Toppers
  • JEE Advanced 2022 Question Paper
  • JEE Advanced 2022 Answer Key
  • JEE Main Question Paper
  • JEE Main Answer key 2022
  • JEE Main Paper Analysis 2022
  • JEE Main Result
  • JEE Exam Pattern
  • JEE Main Eligibility
  • JEE College predictor
[wp_login_wall media_id="424566" text_before_login=" Download Previous Year Papers" text_after_login="Download Previous Year Papers"] combat_iitjee

Related links

  • JEE Study Materials
  • CNG Full Form
  • Dimensional Formula of Pressure
  • Reimer Tiemann Reaction
  • Vector Triple Product
  • Swarts Reaction
  • Focal length of Convex Lens
  • Root mean square velocities
  • Fehling’s solution
testseries_iitjee Predict your JEE Rank .

Chi Square Test

Chi-square tests are commonly used in hypothesis testing. The chi-square statistic investigates the extent of any differences between expected and actual findings given the number of variables in the relationship and the size of the sample.

Table of Content
  •  

A statistical approach for determining the difference between observed and predicted data is the Chi-Square test. This test can also be performed to see if it corresponds with our data’s categorical variables. It can be used to determine whether a discrepancy between two category variables is due to chance or is the result of a relationship.

The observations are divided into mutually exclusive types in normal uses of this test. The test statistic generated from the observations follows a X2 frequency distribution if the null hypothesis states that there are no differences in the population between the classes. The test’s goal is to determine how likely the observed frequencies are if the null hypothesis is correct.

Purpose of a chi-square test

Chi-square is a statistical test that examines the differences between categorical variables from a random sample in order to determine if the expected and actual results are well-fitting.

Chi square test formula

The number of variables that can change in a statistical calculation is represented by degrees of freedom. To verify that chi-square tests are statistically valid, the degrees of freedom can be determined. These tests are widely used to compare observed data with data that would be predicted if a certain hypothesis were correct.

Degrees of Freedom: The number of degrees of freedom does not necessitate any complicated computations. To reduce the number of levels in our category variable, simply subtract one. We’ll use this number to determine which of the infinite chi-square distributions to use.

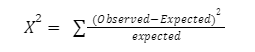
The observed values are those that you have gathered on your own.

Based on the null hypothesis, the predicted values are the expected values.

Chi Square Formula Applications

  • Biologists use it to see if two variables have a significant relationship, such as the relationship between two species in a community.
  • Genetic analysts use this to interpret the numbers in different phenotypic classes.
  • Used in a variety of statistical procedures to help determine whether to accept or reject a hypothesis

Chi-square test p-value 

We produced a chi-square statistic that corresponds to a specific point on a chi-square distribution with the proper amount of degrees of freedom. If the null hypothesis is true, the p-value determines the likelihood of getting a test statistic this extreme. The p-value of our hypothesis test can be calculated using a table of values for a chi-square distribution. If we have statistical software, we can utilize it to get a more accurate estimate of the p-value.

Chi-square test p-value interpretation

The p-value in a chi-square analysis is the probability of getting a chi-square as large as or larger than that in the current trial while still having the data support the hypothesis. It’s the likelihood that variations from the expected are due to chance.

When Should a Chi-Square Test Be Used?

A chi-square test is used to see if observed results match expected results and to rule out the possibility that observations are random. When the data being studied is from a random sample and the variable in question is a categorical variable, a chi-square test is applicable. A categorical variable includes options such as automobile kind, race, educational achievement, male vs. female, and how much someone likes a political candidate among others.

Chi square test vs f test

Difference between Chi square test vs f test given below-

  1. The Chi-square test determines the best fit of the combination of independent variables to the dependent variable, whereas the F-test determines the best fit of the combination of independent variables to the dependent variable. If you conduct a stepwise regression and choose a coefficient above standard error for each combination, the highest of these will be the optimum combination.
  2. The Chi-square test is used to compare population variance to a predetermined value, assess the goodness of fit of a probability distribution, and determine if two qualities are independent. The F-test is used to compare two variances from distinct populations and to compare many means using the ANOVA technique.

P-Value in Chi-square 

The p-value in a chi-square analysis is the probability of getting a chi-square as large as or larger than that in the current trial while still having the data support the hypothesis. It’s the likelihood that variations from the expected are due to chance.

Use of chi-square test

By assuming that the null hypothesis is true, the chi-square test is used to determine how likely the observations are. A hypothesis is a possibility that a certain condition or statement is true, which we can test later.

Conclusion

The chi-square test is used to determine whether observed results match expected results and to rule out the possibility of random observations. A chi-square test is appropriate when the data being analyzed is from a random sample and the variable in issue is a categorical variable. Options such as automobile type, race, educational achievement, male vs. female, and how much someone loves a political candidate (from very much to very little) are examples of categorical variables.

faq

Frequently Asked Questions

Get answers to the most common queries related to the JEE Examination Preparation.

What is a chi-square test and how does it work?

Ans. Finding the squared difference between actual and expected data values and dividing that difference by the expe...Read full

What is the significance of the chi-square X2 independence test?

Ans. The Chi-square test of independence is a statistical hypothesis test that is used to see if two categorical or ...Read full

Is it possible for a chi-square test to be negative?

Ans.  X2can never be negative because i...Read full

Define p-value in chi- square test.

Ans. The goodness of fit of your model is represented by the Chi Square, and the significant value of your tests is ...Read full

Ans. Finding the squared difference between actual and expected data values and dividing that difference by the expected data values is the test statistic. You repeat this process for each data point and total the results. The test statistic is then compared to a theoretical value from the Chi-square distribution.

Ans. The Chi-square test of independence is a statistical hypothesis test that is used to see if two categorical or nominal variables are likely to be connected.

Ans.  X2can never be negative because it is the sum of a series of squared values. If each Z = 0, the least chi squared value is reached, and X2 is also 0.

Ans. The goodness of fit of your model is represented by the Chi Square, and the significant value of your tests is represented by the p value. For example, in a hypothesis test, your results support your hypothesis with a.05 significance (p=.05), indicating that you are 95% confident that your results will repeat, i.e., Hyp will be supported, but there is still a 5% possibility that you will get results.

Trending Topics

  • JEE Main 2024
  • JEE Main Rank Predictor 2024
  • JEE Main Mock Test 2024
  • JEE Main 2024 Admit Card
  • JEE Advanced Syllabus
  • JEE Preparation Books
  • JEE Notes
  • JEE Advanced Toppers
  • JEE Advanced 2022 Question Paper
  • JEE Advanced 2022 Answer Key
  • JEE Main Question Paper
  • JEE Main Answer key 2022
  • JEE Main Paper Analysis 2022
  • JEE Main Result
  • JEE Exam Pattern
  • JEE Main Eligibility
  • JEE College predictor
combat_iitjee

Related links

  • JEE Study Materials
  • CNG Full Form
  • Dimensional Formula of Pressure
  • Reimer Tiemann Reaction
  • Vector Triple Product
  • Swarts Reaction
  • Focal length of Convex Lens
  • Root mean square velocities
  • Fehling’s solution
testseries_iitjee
Predict your JEE Rank
.
Company Logo

Unacademy is India’s largest online learning platform. Download our apps to start learning


Starting your preparation?

Call us and we will answer all your questions about learning on Unacademy

Call +91 8585858585

Company
About usShikshodayaCareers
we're hiring
BlogsPrivacy PolicyTerms and Conditions
Help & support
User GuidelinesSite MapRefund PolicyTakedown PolicyGrievance Redressal
Products
Learner appLearner appEducator appEducator appParent appParent app
Popular goals
IIT JEEUPSCSSCCSIR UGC NETNEET UG
Trending exams
GATECATCANTA UGC NETBank Exams
Study material
UPSC Study MaterialNEET UG Study MaterialCA Foundation Study MaterialJEE Study MaterialSSC Study Material

© 2026 Sorting Hat Technologies Pvt Ltd

Unacademy's Blog!

Share via

COPY