Access free live classes and tests on the app
Download
+
Unacademy
  • Goals
    • AFCAT
    • AP EAMCET
    • Bank Exam
    • BPSC
    • CA Foundation
    • CAPF
    • CAT
    • CBSE Class 11
    • CBSE Class 12
    • CDS
    • CLAT
    • CSIR UGC
    • GATE
    • IIT JAM
    • JEE
    • Karnataka CET
    • Karnataka PSC
    • Kerala PSC
    • MHT CET
    • MPPSC
    • NDA
    • NEET PG
    • NEET UG
    • NTA UGC
    • Railway Exam
    • SSC
    • TS EAMCET
    • UPSC
    • WBPSC
    • CFA
Login Join for Free
avtar
  • ProfileProfile
  • Settings Settings
  • Refer your friendsRefer your friends
  • Sign outSign out
  • Terms & conditions
  • •
  • Privacy policy
  • About
  • •
  • Careers
  • •
  • Blog

© 2023 Sorting Hat Technologies Pvt Ltd

CBSE Class 11 » CBSE Class 11 Study Materials » Physics » Distance Time Graph
CBSE

Distance Time Graph

Time, speed, and distance are the three most important elements to discuss when learning about the distance-time graph. The distance-time graph is crucial in calculating various values associated with motion.

Table of Content
  •  

In physics, the distance-time graph is crucial in calculating various values associated with motion. This graph can also be used in mechanics. It is very simple to compare two journeys that are taking place at the same time using this graph.

In general, it is nothing more than a line graph from which we can derive various concepts such as velocity, speed, and acceleration, among others. These are not just random physics concepts; they also serve as a foundation for applied physics, which is extremely useful when solving real-world problems.

Distance vs Time Graph Definition

Time, speed, and distance are the three most important elements to discuss when learning about the distance-time graph. In a graphical representation, time is shown on the bottom X-axis, while distance is shown on the top Y-axis. Once the axes have been determined, the values can be easily plotted in the graph.

This distance vs. time graph teaches us about the various variations of a body’s movement. For example, a straight line on the graph indicates that the body moves at a fixed (or constant) speed. The following graph depicts the same –

What Is a Velocity Time Graph?

The Velocity-time graph is the graph that explains velocity in relation to time. This explains how velocity changes over time. 

Acceleration is controlled by the slope of a Distance time graph uniform velocity. Consider three objects in a distance-time graph, A, B, and C, all of which are in a horizontal position. 

Object A is represented by a flat horizontal line of uniform velocity on the distance-time graph, indicating that the body is always moving. If the straight line has a slope, it indicates that the body’s velocity is changing at a constant rate or that the body has a constant acceleration

Zero acceleration Velocity Time graph.

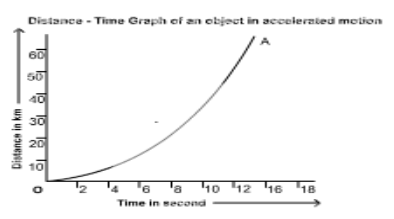
Distance – Time Graph of an Accelerated Motion Body:

When a graph of distance versus time for an object moving with accelerated motion, i.e. with increasing non-uniform speed, the slope of the graph will not be a straight line. The rising trend of the slope corresponds to the rising trend of the velocity.

Here’s a time-distance graph with uniform speed:

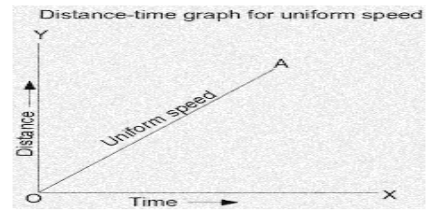
The concept of uniform speed is straightforward. I’m sure you’ve heard of speed; it’s the distance travelled per unit of time. Uniform speed is defined as covering equal distances in equal time intervals, i.e. if your speed is 10 km/h, that must be your speed throughout the journey, i.e. you cover 10 km again in the next hour, 20 km in the next 2 hours, or 30 km in the next 3 hours.

That was simple, but if you covered 20 km in the next two hours, you must have covered 10 km in one hour, 5 km in 30 minutes, or 2.5 km in 15 minutes… so on until zero, which you will clearly understand as you use calculus in physics in higher classes.

As a result, if you plot the distance-time graph of a body moving at uniform speed using the example I provided, or one of your own, you will always end up with a straight line, but the angle will vary depending on whether the body is moving at high or low speed.

This relates to your last question, and uniform speed and constant speed are the same thing because the speed remains constant throughout the journey.

Uses of Distance time graph:

  • The distance-time graph is used to determine the position of an object at any point during the given time interval.
  • To calculate the speed of an object at any point in time within a given time interval.
  • The distance-time graph can be used to study the graph of uniform and non-uniform motion of an object.

What does a velocity time graph show?

We get an increasing graph, or to put it another way, a straight line that is not parallel to the x-axis. It is angled to the x-axis. The velocity time graph of uniform acceleration shows that the velocity increases uniformly with time, resulting in a positive acceleration graph.

The graph for uniform acceleration or uniform acceleration graph or uniform motion graphs or uniformly accelerated motion graph concludes that the body is moving with uniformly increasing velocity and that a particle’s acceleration increases linearly. When a particle begins at rest, its acceleration versus time graph gives the particle’s maximum velocity.

A force time graph for a body’s motion shows the change in linear momentum of the body.

Conclusion

The distance-time graph is crucial in calculating various values associated with motion. Time, speed, and distance are the three most important elements to discuss when learning about the distance-time graph. The Velocity-time graph is the graph that explains velocity in relation to time. Acceleration is controlled by the slope of a Distance time graph uniform velocity. When a graph of distance versus time for an object moving with accelerated motion, i.e. with increasing non-uniform speed, the slope of the graph will not be a straight line. The distance-time graph is used to determine the position of an object at any point during the given time interval. The distance-time graph can be used to study the graph of uniform and non-uniform motion of an object. The velocity time graph of uniform acceleration shows that the velocity increases uniformly with time, resulting in a positive acceleration graph.

faq

Frequently Asked Questions

Get answers to the most common queries related to the CBSE Class 11 Examination Preparation.

How do you compute time based on distance and time?

Ans. Distance travelled divided by time equals the rate of change in position, or speed. Divide the distance travell...Read full

Can you convert time to distance?

Ans. The equivalent formula d = rt, which means distance equals rate times time, can be used. To calculate speed or ...Read full

How does time change as a result of distance?

Ans. However, distance is related to time. Two objects travelling at the same velocity but covering different distan...Read full

How do I find out my step distance?

Ans. Walk from one end of the course to the other at a normal pace, counting your steps as you go. Divide the total ...Read full

Ans. Distance travelled divided by time equals the rate of change in position, or speed. Divide the distance travelled by the rate to find the time. For example, if Cole drives his car at 45 km/h and travels 225 km, he travelled for 225/45 = 5 hours.

Ans. The equivalent formula d = rt, which means distance equals rate times time, can be used. To calculate speed or rate, use the speed formula, s = d/t, which means speed equals distance divided by time. To calculate time, use the time formula, t = d/s, which means time equals distance divided by speed.

Ans. However, distance is related to time. Two objects travelling at the same velocity but covering different distances take different amounts of time to complete. The formula d=rt (distance = rate or speed * time) can be used. This is due to the fact that an object’s velocity is calculated by comparing the distance travelled to a unit of time.

Ans. Walk from one end of the course to the other at a normal pace, counting your steps as you go. Divide the total number of steps by 100 to get the length of one step. For example, if you walked 100 feet in 50 steps, your step length is 2 feet. Calculate 2 1/2 feet per step if you took 40 steps.

Crack K-12 with Unacademy

Get subscription and access unlimited live and recorded courses from India’s best educators

  • Structured syllabus
  • Daily live classes
  • Ask doubts
  • Tests & practice
Learn more

Notifications

Get all the important information related to the CBSE Class 11 Exam including the process of application, important calendar dates, eligibility criteria, exam centers etc.

Data Correction
Exam Pattern for Class 11th
Registration Process
Syllabus
See all

Related articles

Learn more topics related to Physics
Zeroth Law of Thermodynamics

Learn the basics of Thermodynamics, an essential branch in physics that mainly focuses on heat, work, energy, temperature, and their interrelations.

Young’s Modulus

In this article we will read about Young’S modulus. This will also include young’s modulus formula and young’s modulus of steel.

Work, Energy and Power

Work, energy and power Class 11: Definition of power in physics

Work, Energy and Power

Work Energy and Power- Definition, formula, and Example

See all
Access more than

5,130+ courses for CBSE Class 11

Get subscription

Trending Topics

  • Withdrawal Slip
  • Wildlife Conservation
  • Moving Coil Galvanometer
  • Ogive Curves
  • PPT Full Form
  • Reordering Of Sentences
  • Central Problems Of An Economy
  • Transcription In Eukaryotes
combat_iitjee

Important Links

  • NCERT Solutions
  • NCERT Books
  • Physics Formulas
  • Maths Formulas
  • Chemistry Formulas
testseries_iitjee
Download NEET 2022 question paper
.
Company Logo

Unacademy is India’s largest online learning platform. Download our apps to start learning


Starting your preparation?

Call us and we will answer all your questions about learning on Unacademy

Call +91 8585858585

Company
About usShikshodayaCareers
we're hiring
BlogsPrivacy PolicyTerms and Conditions
Help & support
User GuidelinesSite MapRefund PolicyTakedown PolicyGrievance Redressal
Products
Learner appLearner appEducator appEducator appParent appParent app
Popular goals
IIT JEEUPSCSSCCSIR UGC NETNEET UG
Trending exams
GATECATCANTA UGC NETBank Exams
Study material
UPSC Study MaterialNEET UG Study MaterialCA Foundation Study MaterialJEE Study MaterialSSC Study Material

© 2025 Sorting Hat Technologies Pvt Ltd

Unacademy
  • Goals
    • AFCAT
    • AP EAMCET
    • Bank Exam
    • BPSC
    • CA Foundation
    • CAPF
    • CAT
    • CBSE Class 11
    • CBSE Class 12
    • CDS
    • CLAT
    • CSIR UGC
    • GATE
    • IIT JAM
    • JEE
    • Karnataka CET
    • Karnataka PSC
    • Kerala PSC
    • MHT CET
    • MPPSC
    • NDA
    • NEET PG
    • NEET UG
    • NTA UGC
    • Railway Exam
    • SSC
    • TS EAMCET
    • UPSC
    • WBPSC
    • CFA

Share via

COPY