In mathematics, the ratio is described as a term that is used for comparing 2 or even more numbers. It is used to indicate how small or big a particular quantity is as compared to another quantity. Specifically, ratio comparison between two quantities is done through the utilization of division. The dividend in the ratio is referred to as ‘antecedent’ whereas the divisor is referred to as ‘consequent’. Ratios can specifically be classified into two main types. One of these is the whole ratio whereas the other is referred to as the part ratio.
PE ratio
The full form of PE ratio is the price – to earnings ratio. The PE ratio is defined as the ratio between the stock prices of a company as well as the earning for each share. It helps in measuring the stock prices concerning the profits. From the definition, it is clear that an individual easily calculates PE by dividing the price of the stock by EPS or per-share earnings. The formula for PE ratio is given by PE ratio = Price over each share / Earnings over each share In general terms, if a PE ratio is low then it gives indications of cheap stock whereas a high PE ratio gives indications of expensive stock. In this context, it should be mentioned that the PE ratio also gives indications of how much the investor is expecting the earnings to develop in the coming future. The higher the ratio, the better will be the prospects of growth.Poisson ratio
Poisson ratio is described in mechanics as a negative value of the ratio between transverse strain and axial strain or lateral strain. The Poisson ratio has been named after well-known scientist Simeon Poisson. This ratio is identified with the ‘nµ’ which is a Greek letter. In simple words, the passion ratio is the division of transversal expansion by the axial compression of certain small changes in these values. The range of Poisson ratio for any material varies within -1.0 and +0.5. Poisson ratio is a unitless quantity. Considering the scalar or vector nature of the quantity it should be mentioned that the Poisson ratio is a scalar quantity. The Poisson effect is important in this context. When a certain material is stretched in a particular direction, it can be seen that the material tends to compress in a direction that is perpendicular to the applied force and vice versa. The measurement of this specific occurrence is given with the help of Poisson’s ratio. For instance, if a rubber band is stretched it tends to become thinner. The Poisson ratio for different materials is different. However, it is seen to lie within 0 and 0.5. Poisson ratio for some materials have been provided in the following- Cast iron: 0.21 to 0.26
- Rubber: 0.4999
- Cork: 0
- Copper: 0.33
Call Put Ratio
The Put-Call ratio is mostly defined as a measurement that is mainly used by investors to gauge the market’s overall mood. The term ‘put’ is an option that refers to a person’s right of selling a particular asset at a price that has been determined earlier. Secondly, the ‘call’ is an option that essentially determines an individual’s right to buy a particular asset at a price that has been determined previously. If the Traders are seen to buy more puts compared to calls, then it signals a rise in sentiment that is bearish. However, if they are buying more calls compared to puts, then it means that the traders can predict a bull market soon. Understanding the Put-Call ratio is a vital aspect. It is calculated by dividing the different put options that have been traded by the number of call options that have been traded. If the Call – Put ratio value is one then it means that the number of call buyers is the same as that of the number of put buyers. In this context, it should be mentioned that a ratio of 1 is not the accurate time to start measuring the sentiments within the market.Conclusion
Throughout the article, the core topic of ratio has been discussed. This is a vital topic in Quantitative aptitude. The ratio is the division of two numbers that are used for comparing two given values. Under this core topic, several subtopics have been discussed including PE ratio, Poisson ratio, and Call-Put ratio.
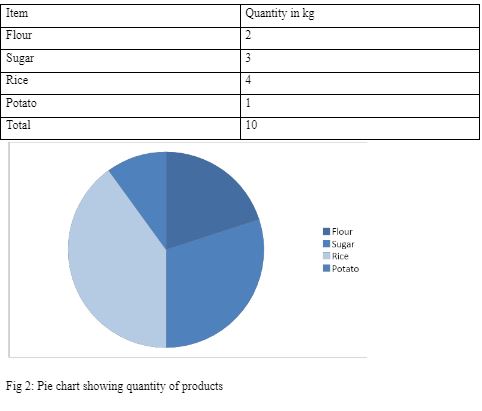
Question 2: A person bought the following quantities of different products. Flour: 2 kg, Sugar: 3 kg, Rice: 4 kg, Potato: 1 kg. Represent this in the form of a pie chart.
The above data can be presented in the following form

 Profile
 Settings
 Refer your friends
 Sign out


