A pie chart can be defined as a visual representation of certain types of data in the form of a pie or a circular chart. In the pie chart, each slice within the pie represents a particular size of the data. A set of categorical variables along with numerical variables is required for representing the data in pie chart format. The length of the arc of each slice as well as the central angle and the area that it forms within the pie chart is directly proportional to the quantity represented by it.
Pie charts are used for displaying the contribution of a particular slice within the overall pie. In this context, it should be mentioned that pie charts always utilise a single data series. The steps for creating a pie chart in excel have been outlined in the following.
After the pie chart is prepared, the student can choose to make several alterations to the pie chart. For instance, the students can select a set of data and name the slices within the pie chart accordingly. The student can further drag the slices within the pie chart to make them more prominent.
A pie chart is essentially a circle representing different parts of a whole. Each of the different slices of the pie represents a particular section of the data . The overall pie represents 100 % of the data. The size occupied by each slice is directly proportional to the value occupied by the data within the whole. Pie charts can sometimes become more complicated if too many categories of data are present. An effective pie chart will be able to provide proper visual representation at just a glance. There are many methods through which pie charts can be created. Pie charts can be created through the use of MS Excel. Moreover, certain online pie chart makers also help in creating effective pie charts.
Some online platforms that function as effective pie chart makers include Code beautify and Canva’s pie chart maker. In this context, it can be discussed that the pie chart maker offered by Canva can make pie charts within seconds. It is very easy to use and one can easily start with the template. The platform has several pie charts from which the user can choose easily. After choosing, an individual just needs to click on that chart. Further, he or she can also manage the background, fonts, colours, and more.
A pie chart is an important tool for visually representing a range of data. It is particularly used when one needs to properly show different parts of a whole. In the following section, some questions concerning the pie chart have been discussed.
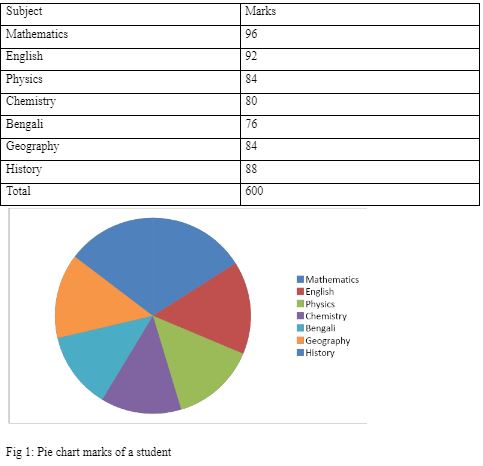
Question 1: A student has obtained a total of 600 marks in his tests out of 700. The marks in different subjects are given as follows: Maths: 96, English: 92: Physics: 84, Chemistry: 80, Bengali: 76, Geography: 84, History: 88. Represent this in a pie chart.
Answer: The above data can be represented in the following form
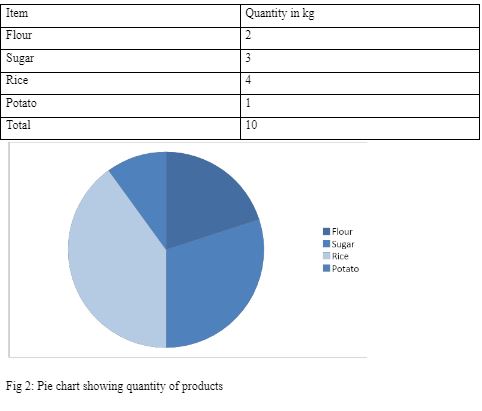
Question 2: A person bought the following quantities of different products. Flour: 2 kg, Sugar: 3 kg, Rice: 4 kg, Potato: 1 kg. Represent this in the form of a pie chart.
The above data can be presented in the following form
The overall article has been written on the main topic of the Pie Chart. The Pie Chart is a type of visual representation of data that helps in representing different parts of a whole. Under this main topic, several subtopics have been discussed which include Pie Chart in Excel, Pie Chart maker, and questions of a pie chart.
 Profile
 Settings
 Refer your friends
 Sign out