Access free live classes and tests on the app
Download
+
Unacademy's Blog!
Login Join for Free
avtar
  • ProfileProfile
  • Settings Settings
  • Refer your friendsRefer your friends
  • Sign outSign out
  • Terms & conditions
  • •
  • Privacy policy
  • About
  • •
  • Careers
  • •
  • Blog

© 2023 Sorting Hat Technologies Pvt Ltd

[wp_login_wall media_id="448945" text_before_login="Download JEE Maths Formulas" text_after_login="Download JEE Maths Formulas"]

Trending Topics

  • JEE Main 2024
  • JEE Main Rank Predictor 2024
  • JEE Main Mock Test 2024
  • JEE Main 2024 Admit Card
  • JEE Advanced Syllabus
  • JEE Preparation Books
  • JEE Notes
  • JEE Advanced Toppers
  • JEE Advanced 2022 Question Paper
  • JEE Advanced 2022 Answer Key
  • JEE Main Question Paper
  • JEE Main Answer key 2022
  • JEE Main Paper Analysis 2022
  • JEE Main Result
  • JEE Exam Pattern
  • JEE Main Eligibility
  • JEE College predictor
[wp_login_wall media_id="424566" text_before_login=" Download Previous Year Papers" text_after_login="Download Previous Year Papers"] combat_iitjee

Related links

  • JEE Study Materials
  • CNG Full Form
  • Dimensional Formula of Pressure
  • Reimer Tiemann Reaction
  • Vector Triple Product
  • Swarts Reaction
  • Focal length of Convex Lens
  • Root mean square velocities
  • Fehling’s solution
testseries_iitjee Predict your JEE Rank .
JEE Main 2026 Preparation: Question Papers, Solutions, Mock Tests & Strategy Unacademy » JEE Study Material » Mathematics » A Study on the Variance Deviation for Grouped and Ungrouped Data
[wp_login_wall media_id="448945" text_before_login="Download JEE Maths Formulas" text_after_login="Download JEE Maths Formulas"]

Trending Topics

  • JEE Main 2024
  • JEE Main Rank Predictor 2024
  • JEE Main Mock Test 2024
  • JEE Main 2024 Admit Card
  • JEE Advanced Syllabus
  • JEE Preparation Books
  • JEE Notes
  • JEE Advanced Toppers
  • JEE Advanced 2022 Question Paper
  • JEE Advanced 2022 Answer Key
  • JEE Main Question Paper
  • JEE Main Answer key 2022
  • JEE Main Paper Analysis 2022
  • JEE Main Result
  • JEE Exam Pattern
  • JEE Main Eligibility
  • JEE College predictor
[wp_login_wall media_id="424566" text_before_login=" Download Previous Year Papers" text_after_login="Download Previous Year Papers"] combat_iitjee

Related links

  • JEE Study Materials
  • CNG Full Form
  • Dimensional Formula of Pressure
  • Reimer Tiemann Reaction
  • Vector Triple Product
  • Swarts Reaction
  • Focal length of Convex Lens
  • Root mean square velocities
  • Fehling’s solution
testseries_iitjee Predict your JEE Rank .

A Study on the Variance Deviation for Grouped and Ungrouped Data

In this article we will cover Variance deviation, Variance Formulas for Ungrouped Data, Variance Formulas for Grouped Data. The variance calculates how far on average each point deviates from the mean. Variance is the average of all the data points inside a group, whereas standard deviation is the square root of variance. For traders who use them to gauge market volatility, the two ideas are significant and useful.

Table of Content
  •  

The variance formula in probability theory and statistics calculates how widely distributed a set of numbers is. It is a numerical value used to describe how far members of a group differ from one another. The variance is large if individual observations deviate significantly from the group mean, and vice versa. Variance is a crucial tool. The variance, also known as the second central moment of a distribution and the covariance of the random variable with itself, is equal to the standard deviation squared.

When the variance is 0, all the values are the same. A small variance shows that the data points tend to be relatively close to the mean and hence to each other, whereas a high variance suggests that the data points are widely dispersed both from the mean and from one another. It should be emphasised that variance is always non-negative.

We will learn about variance deviation in this article, along with the variance deviation of both grouped and ungrouped data.

Variance Deviation Definition

“Variance measures how far off data points are from the mean. Data points with low variation tend to be comparable to one another and deviate from the mean less frequently. High variance denotes greater variability and wider deviations from the mean in data values”.

How Do Find Out the Variance

We can compute the variance as follows:

  1. Find the data set’s mean. Divide the total data values by the sample size, n.
  2. For each data value, calculate the squared deviation from the mean. Square the result after deducting the mean from each data point.
  3. Discover the total squared differences.
  4. Do the variance calculation.

Formula of Variance

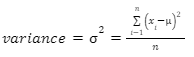
The sum of the squared deviations between each data point and the mean, divided by the number of data values, is the variance of a. The variance calculations in this calculator are done using the formulas below.

Variance Formulas for Ungrouped Data

For ungrouped data, population’s the variance is:
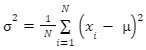
Where,

σ² denotes variance

xi denotes ith observation of  data

μ denotes population mean

N denotes observations total no. 

For ungrouped data, the sample variance is:

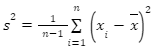
s² Denotes sample variance  

xi Denotes ith observation of data

n Sample size 

Variance Formulas for Grouped Data

For grouped data, a population’s variance is:

For grouped data, the sample variance is:

Where,

ƒ denotes frequency of the class 

m denotes midpoint of the class

Conclusion

In this article, we learned that Statistics’ use of variation is crucial because it enables us to calculate the spread of a group of variables around their mean. These variables make up the set that is being measured or examined. The variance serves as a good indicator of variability. If the scores in our sample of data are dispersed, the variance will be high. On the other hand, if the scores are evenly distributed around the mean, the variance will be lower. Variance matters for two reasons in particular: because they are sensitive to variance, for use with parametric statistical tests. The sample variances are used to determine if the populations the samples represent are distinct from one another.

faq

Frequently asked questions

Get answers to the most common queries related to the JEE Examination Preparation.

What does group data variance mean?

Answer. The variance formula calculates the degree of dispersion of a set of numbers in probability theory and stati...Read full

How is variance deviation determined?

Answer. To obtain the squared differences, we square the results after subtracting the mean from each value to calcu...Read full

Why Do Statisticians Use Mean-Variance and Standard Deviation?

Answer. The sum of all squared differences between all numbers and means is known as variance, where N is the total ...Read full

Which formula—Variance Formula or Standard Deviation Formula—is preferable?

Answer. Each of them serves a distinct role. While the variance is typically considerably more valuable theoreticall...Read full

Why is variance in data important?

Answer. In statistics, the variance is used to assess how well the mean summarises all of the data. For instance, th...Read full

Answer. The variance formula calculates the degree of dispersion of a set of numbers in probability theory and statistics. It serves to quantify the degree to which group members differ from one another. When individual observations deviate significantly from the group mean, the variance is large, and the opposite is also true.

Answer. To obtain the squared differences, we square the results after subtracting the mean from each value to calculate the variance. The average of those squared differences is then calculated. The variance is the outcome. A distribution’s standard deviation serves as a gauge for how dispersed the numbers are.

Answer. The sum of all squared differences between all numbers and means is known as variance, where N is the total number of components or frequency of the distribution, and μ is the mean. The square root of variance yields standard deviation. It is a gauge of how much data deviates from the mean.

Answer. Each of them serves a distinct role. While the variance is typically considerably more valuable theoretically, the SD is typically more beneficial to describe the variability of the data. For instance, the variance of the sum of the uncorrelated distributions (random variables) equals the total of the variances of the distributions.

Answer. In statistics, the variance is used to assess how well the mean summarises all of the data. For instance, the more range exists within the set the larger the variance. This information can be used by data scientists to deduce that the mean might not accurately represent the set as it would if the variance were smaller.

Trending Topics

  • JEE Main 2024
  • JEE Main Rank Predictor 2024
  • JEE Main Mock Test 2024
  • JEE Main 2024 Admit Card
  • JEE Advanced Syllabus
  • JEE Preparation Books
  • JEE Notes
  • JEE Advanced Toppers
  • JEE Advanced 2022 Question Paper
  • JEE Advanced 2022 Answer Key
  • JEE Main Question Paper
  • JEE Main Answer key 2022
  • JEE Main Paper Analysis 2022
  • JEE Main Result
  • JEE Exam Pattern
  • JEE Main Eligibility
  • JEE College predictor
combat_iitjee

Related links

  • JEE Study Materials
  • CNG Full Form
  • Dimensional Formula of Pressure
  • Reimer Tiemann Reaction
  • Vector Triple Product
  • Swarts Reaction
  • Focal length of Convex Lens
  • Root mean square velocities
  • Fehling’s solution
testseries_iitjee
Predict your JEE Rank
.
Company Logo

Unacademy is India’s largest online learning platform. Download our apps to start learning


Starting your preparation?

Call us and we will answer all your questions about learning on Unacademy

Call +91 8585858585

Company
About usShikshodayaCareers
we're hiring
BlogsPrivacy PolicyTerms and Conditions
Help & support
User GuidelinesSite MapRefund PolicyTakedown PolicyGrievance Redressal
Products
Learner appLearner appEducator appEducator appParent appParent app
Popular goals
IIT JEEUPSCSSCCSIR UGC NETNEET UG
Trending exams
GATECATCANTA UGC NETBank Exams
Study material
UPSC Study MaterialNEET UG Study MaterialCA Foundation Study MaterialJEE Study MaterialSSC Study Material

© 2026 Sorting Hat Technologies Pvt Ltd

Unacademy's Blog!

Share via

COPY