In a variety of scenarios, we categorise and count items by grouping them into groups of comparable objects. This has been the most fundamental motivator for knowing whole numbers as well as how to add, multiply and subtract them. Using sets and Venn diagrams in place of the conventional method is a lot more fun and easier. Here we classify the objects and values in sets and do various operations on them such as union, Intersection, etc. They are much similar to conventional addition and subtraction. Let us understand first what are sets and the Venn diagram.
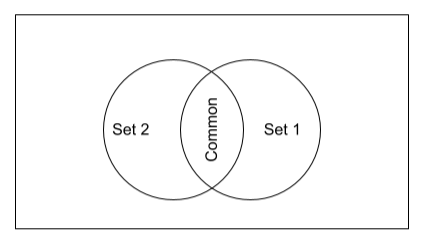
A Venn Diagram is a visual representation of the relationship between two sets. Commonly, Venn Diagrams usually are represented by Rings or Ellipses. The Set Items are arranged inside the Circle. We’ve picked a few instances and described those to assist you to examine the Connection in Sets utilizing Venn Diagram. Below is the syntax of the Venn Diagram.
The syntax represents two sets that have few elements connected with each other and those are common among them, which is why shared with each other. And the area inside the rectangle is called the universe for them.
A set is simply a collection of items because we require a few additional terms, signs, and visualisations to communicate about sets in a meaningful way.
In everyday conversation, we interpret the meaning of our reality by categorising groups of objects. There are several terms in English for this kind of grouping. For instance, we may refer to a ‘flock of geese,’ a ‘group of sheep,’ a swarm of honeybees,’ or perhaps a ‘colony of ants.’
In maths, we accomplish something similar by grouping numbers, algebraic figures, as well as other objects into groupings known called sets. The entities in such sets are referred to as set elements.
Below is an example of sets,
N={1,3,5,7,11}
This set is a set of prime numbers and always the set values are enclosed in brackets {}.
Let us now have a look at the various operations that are done on sets and understand them using the Venn diagram.
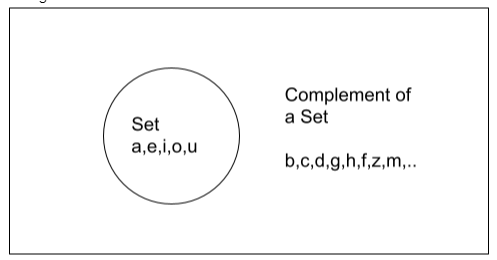
A complement of a set means a set of values that are not in that set. For example a set of odd numbers. The complement of that set would be a set of even numbers. If we look at it in the venn diagram. It will be shown as
Where the set contains vowels and its compliments are a set of consonant letters. This is the formula for the Venn diagram in finding the complement of a set.
A union of a set is just like the addition of two or more sets. It is represented by the symbol for set unions ‘∪’. For example, A∪B, which means a set of A and B combined together.
Below Venn diagram example represents the same
Where the two sets are a set of vowels and a set of consonants. A union of them would be a set of vowels and consonants, or we can say a set of complete alphabets.
This is the formula of the Venn diagram for finding the union of sets.
For more clarification consider set A={1,2,3,4,5,6} and set B={12,13,14,15,16}. So, A∪B will be A∪B={1,2,3,4,5,6,12,13,14,15,16}.
An intersection of a set is the common element that a set has. It is quite similar to finding out the common elements. It is represented by the symbol for a set of intersections ‘∩’. For example consider a set A={1,2,3,4,5,6} and a set B={5,6,7,8,9,10}. So, A∩B would be A∩B={5,6}.
Here, the union of two sets would be the common elements that are inside both the circles, such as here s and n are the intersection of the two sets A and B.
This is the formula of the Venn diagram for finding the intersection of sets.
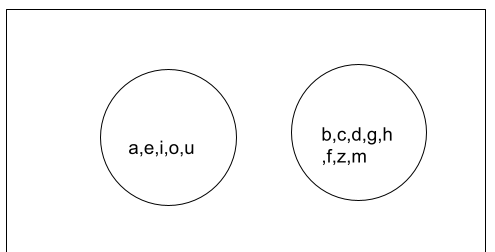
Two sets are disjoint among them when they have nothing in common among them. For example, set A={1,2,3,4,5,6} and set B={12,13,14,15,16} are disjoint sets.
Again, if we see the same concept in the Venn diagram. It will be represented as,
Here, both sets A and B disjoint. And when two sets are disjoint they can be represented as,
A∩B = ⊘, where ⊘ shows an empty set of A∩B.
To sum up, A Venn diagram is a graphical representation of sets and values in the form of circles or ovals or ellipses. There may be two or more sets present inside the Venn diagram. And a set is a collection of similar types of values such as a collection of vowels or nouns, etc. Understanding sets operations using the Venn diagram are very simple and fun. In a Venn diagram, the two sets that share the data are kept in the intersection of those circles and is an example of the intersection of sets. Similarly, the values outside the set in the universe are known as the complement of that set. And when two circles with values do not intersect in a Venn diagram they are distinct. Moreover, if we combine and write the value of two or more circles that is the union of two or more sets.
 Profile
 Settings
 Refer your friends
 Sign out