In mathematics, the points on the curve help in determining the value of the function. When a particular function is given, the largest and smallest values are the ones most of them are interested in. The information for finding these values is to create accurate graphs. The maxima and minima are used to determine extreme values in the given set of ranges.
Turning Point
The turning point is similar to the stationary point. It depicts the lowest and highest point of the curve. This point depicts the increasing or decreasing value of a function in a given set of ranges. These increasing and decreasing values are termed maxima and minima.
Maxima and Minima-
Maxima and minima are known as the extremes of a given set of functions. It represents the maximum and minimum values on a given graph. The maxima and minima can be absolute and local. Maxima and Minima are the peaks and valleys in the curve of a function, respectively. The term extrema are the combination of maxima and minima.

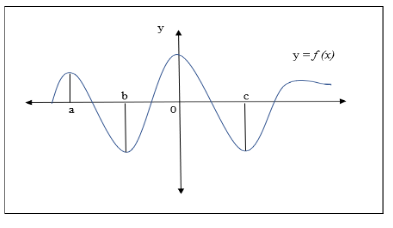
Maxima is x= a and x= 0 and minima is x= b and x= c
1.Local maxima- The local maxima are the value of a function at a point in an interval during which the values near the point are less than the value at the point
For example-
The point x = b is at the local maximum for f (x) that is if near to it (b−𝛿, b+𝛿) where 𝛿 is small,
f(x) < f(b) for all
X ∈ (b−𝛿, b+𝛿) ∖{b}.
This simply means that if we consider a small region around x = b, f(b) should be the maximum in that interval.
2.Local minima- The local minima represent the value of a function at a particular interval where the value of the function near the point is greater than the value at the point.
For example-
If point x = a is the local minimum for f(x) and in the neighbourhood of a, it is (a−𝛿, a+𝛿), (where 𝛿 can have small values),
f(x) > f(a) for all
X ∈ (a−𝛿, a+𝛿) ∖{a}.
This depicts that if we see the small interval around x = a, f(a) is the minimum in that interval.
3.Absolute/global maxima- Under the entire range of set values, the highest point is considered as the absolute maxima. There can only be one absolute maximum for a function.
4.Absolute/global minima- Under the entire range of set values, the lowest point is considered as the absolute minima. There can only be one absolute minimum for a function.
Methods to calculate Maxima and Minima-
- First derivative test– As we move toward the maximum or minimum point, the value increases and decreases respectively, then at that particular point, it becomes zero and again starts decreasing and increasing respectively as we move away from the point.
- Second derivative test– For finding maxima and minima using the second-derivative test, we need to first figure out the first derivative of the given function if it gives a slope equal to 0.
Let’s say that function f at the critical point is f’(c)=0,
So, the first derivative is at the critical point x = c (f’’(c) = 0)
For the second derivative test, we can use this value
If the second derivative lies between the given the range, then, the value of the point will be-
- Local maxima: If f”(c) < 0
- Local minima: If f”(c) > 0
- Test fails: If f”(c) = 0
Stationary points-
As per Layman’s statement, it is a point where the function of the variable can neither increase nor decrease. If the gradient of a curve at a point is zero, then it is a stationary point. As the word stationary means stillness or not moving, the same is implied for this. Stationary points play an important role in solving problems of mensuration.
The location of the stationary curve is employed in curve sketching.
If
y = f (x)
then the stationary point will be
f’(x)=0
or
dy/dx = 0
Conclusion-
These techniques of different points and finding the lowest and highest value is to inspect the curve of a function. The concept of the derivative is the basic aspect to find the maxima and minima of the given function. The Maxima and minima are the peaks and valleys, respectively and are important in analysing the graphical interpretation of a given function.
The derivatives concept is widely used in solving problems related to mensuration and physics, and it can help in representing changes in temperature, business analysis, etc.
 Profile
 Settings
 Refer your friends
 Sign out


