 Profile
 Settings
 Refer your friends
 Sign out


Elasticity:
Elasticity is defined as the ability of a deformed body to go back to its authentic form when the forces inflicting the deformation are removed. A body with this potential is stated to behave elastically and is called an elastic body.
For example – Quartz fibre.
Plasticity:
When pressure is “regularly increased” past the elastic limit, the material undergoes “plastic deformation”.
For example – paraffin wax
Hooke’s Law:
This famous law of physics was given by a well-known physicist Robert Hooke. The relationship between “stress and strain” is shown by “Hooke’s Law”. According to the statement of Hooke’s law, “for small deformations, stress shows direct proportionality to strain. Thus,
Stress ∝ Strain
Or, Stress = E × Strain
Where E is defined as the constant of proportionality and is known as the Modulus of Elasticity.
Hooke’s law for stress and strain is valid for all the material. It is an empirical law.
Stress-Strain Curve:
The Stress-Strain curve is a type of graph plotted between “stress and strain”. This graph explains the relationship between “stress and strain” of different materials when tensile stress is applied to them.
This curve is plotted on the basis of an experimental result. In this experiment, we take a cylinder or twine and stretch it by an applied force or tensile stress. Then we note the change in length (strain) of that body and the stress that is applied to cause the change in length. With the help of this reading, we plot a graph by taking strain along the x-axis and stress along the y-axis.
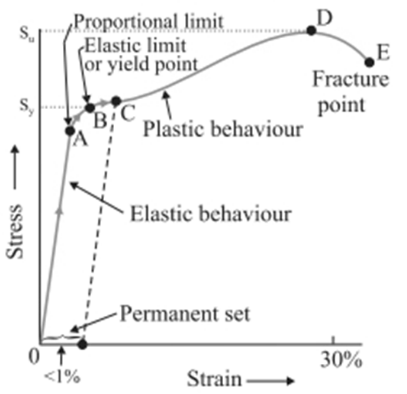
Explanation of the graph:
The region O To A – In the graph above, we can see that region O to A is a straight line or linear; this implies that Hooke’s law is obeyed in this region.
The region A to B- In regions A to B, the stress applied and the strain produced are not proportional to each other. So we can conclude that if the exerted force is removed, the body will return to its initial dimension.
The point B-The point B in the curve is known as the yield point or the elastic limit of the curve. The tensile stress corresponding to the yield point is named yield stress and denoted by Sy. Further, as we increase the load, the stress starts exceeding the yield stress. This means now even if there is a small change in stress, the strain will increase rapidly.
Region B to D- In this region, the strain increases very quickly even if we change the stress by a small amount. If we withdraw the exerted force at point C between B and D, the body will not return to its initial dimension. Hence, we can conclude that if the applied tensile stress is null, the strain will not be equal to zero. This is a deformation produced in the body, and we call this deformation plastic deformation. At this point, the material is said to have a permanent set.
The point D and E- In the graph, the “D point” is called the “ultimate tensile strength of the material”. Beyond point D, additional strain is produced in the material; even if the applied tensile strength is reduced, fracture occurs. Point E is defined as a fracture point.
- If the distance between point E and point D is not much, then the material is called brittle material.
- If point E and point D are far apart from each other, then the material is known as ductile material.
The stress-strain curve depends upon the material and varies from material to material. For example, the stress-strain curve for ductile material is different from the curve for the brittle material.
The curve shown above in figure is the stress-strain curve for a ductile material. Some examples of ductile materials are – copper, aluminium, and magnesium alloys.
Brittle material is defined as the material which shows very small elongation before reaching the fracture point.
For example – high carbon steel and concrete.
The permanent elongation is less than 10% in the stress-strain curves for brittle material.
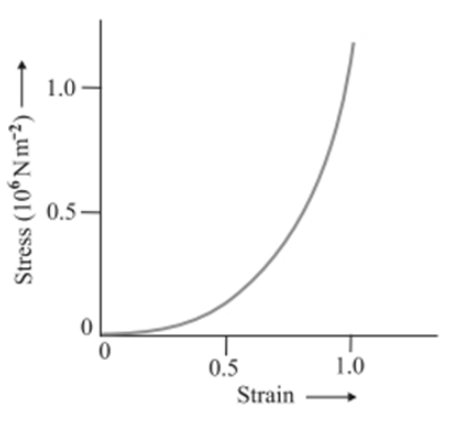
Exception
The figure given below represents the stress-strain curve for the elastic tissue present in the aorta, which is located in the heart. In this stress-strain curve, the elastic region is very large, but still, it doesn’t follow Hooke’s law. Also, plastic regions are absent. Such exceptions like elastic tissue in the aorta and plastic rubber are named Elastomers. They can be stretched to cause large strains.
Conclusion
It is a graph that is plotted on the basis of an “experimental result”. This graph or curve explains the relationship between tensile stresses applied on a material and the strain. We gradually increase the applied tensile stress and note the change in strain, respectively. With the help of these readings, we plot the graph. This graph is not similar for all materials; it varies from one material to another. Stress-strain curves also help us to differentiate between brittle and ductile material. With the help of the stress-strain curve, we can easily identify the material which follows Hooke’s law.


