The hot tea kept open gets cold, but the temperature of the cold drink held in the open surrounding gets normal. Why does it happen? Why didn’t cold drinks become colder or tea become hotter? The answer to these questions lies in Newton’s law of cooling, which states that the cooling rate is proportional to the temperature difference between the surroundings and the object. In this plotting a curve study material, we will be learning about the topic in detail.
The heat tends to move from the region of higher temperature to the lower temperature. This is because every object and substance works to attain a state of equilibrium. The same is the case with the heat.
Consider the example of the flow of water. Two buckets, one full and the other with very little water, are connected. In this case, water will move from the more volume bucket towards the low volume bucket. It continues till the volume becomes some in both the buckets.
Thus, the same happens with the heat of the object. It moves from a region of high temperature to a region of low temperature till it becomes the same.
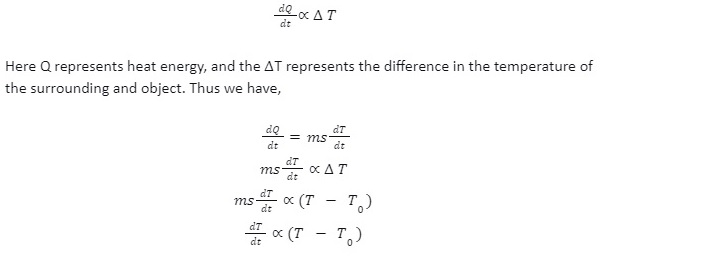
Newton was the first to determine the relationship between the heat lost from the body and its temperature. The law states that the rate of heat loss varies directly with the temperature difference between the surroundings and the system. Newton’s law can be represented mathematically as:
Here m is the mass and s is the specific heat of material.
Thus, the equation clarifies that the temperature of the system or the object decreases with time.
The cooling curve is the graph that shows the relationship between the body’s temperature concerning time. The slope of the curve provides the rate of fall of the temperature since the heat exchange causes the change in the object’s state.
Therefore, the slope of the cooling curve also demonstrates the change in the object’s state. Thus the cooling curve is a line graph used to map the phase change of the graph.
The cooling curve is plotted to determine the relationship between the body’s temperature with time.
The set of the experiment is shown in the above diagram.
The calorimeter is filled with hot water and covered with a wooden lid.
Two thermometers are placed, one in the calorimeter and the other in the enclosure.
Take the minor reading of the thermometers (T_o of enclosure) and then start the stop clock.
Keep stirring the water in a calorimeter for uniform cooling.
When the thermometer reading falls significantly, stop the clock and note down the reading.
Keep stirring the water and record the reading of the thermometer. Initially, temperature fall will be rapid, but it will decrease with time.
When the temperature falls very slowly, stop the clock and calculate using the observations.
The note down the observations of the experiment:
Least count of the thermometer placed in enclosure water = ____
Least count of the thermometer placed in calorimeter = ______
Least count of stopwatch = ______
Serial Number | Time (t) | Temperature of water in calorimeter (T °C) | Temperature of water in enclosure (T0 °C) | Difference in temperature (T-T0) |
To plot the cooling curve, we take the temperature on the y-axis and time on the x-axis.
From the cooling curve, we can infer that initially, the temperature falls rapidly. Then, after some minutes, the fall becomes slower, and finally, we can see that it becomes approximately constant. Thus this proves Newton’s law of cooling.
The Cooling curve has extensive use in science and regular day-to-day life. Some of them are mentioned below.
In forensic labs, the temperature of the dead body and the surrounding temperature is considered. It calculates the rate of fall of temperature, which helps determine the victim’s death time.
Newton’s law of cooling also plays a significant role in measuring the temperature of the heated metal. Blacksmiths can use the principle of this law and determine the temperature of the metal, which is challenging to measure by the thermometer.
It will melt when ice cream is kept outside at average room temperature. This is because the heat starts to travel from the surrounding area to the ice cream, which increases its temperature.
The law also helps us determine the time it will take for any metal to cool down.
Through this study material notes on plotting a cooling curve, we understand the topic in detail. The cooling curves prove Newton’s law of motion which states that the exchange of heat is directly proportional to the difference in temperature of the system and surroundings. Newton’s law of cooling and cooling curves is used for various industries.
 Profile
 Settings
 Refer your friends
 Sign out