Access free live classes and tests on the app
Download
+
Unacademy
  • Goals
    • AFCAT
    • AP EAMCET
    • Bank Exam
    • BPSC
    • CA Foundation
    • CAPF
    • CAT
    • CBSE Class 11
    • CBSE Class 12
    • CDS
    • CLAT
    • CSIR UGC
    • GATE
    • IIT JAM
    • JEE
    • Karnataka CET
    • Karnataka PSC
    • Kerala PSC
    • MHT CET
    • MPPSC
    • NDA
    • NEET PG
    • NEET UG
    • NTA UGC
    • Railway Exam
    • SSC
    • TS EAMCET
    • UPSC
    • WBPSC
    • CFA
Login Join for Free
avtar
  • ProfileProfile
  • Settings Settings
  • Refer your friendsRefer your friends
  • Sign outSign out
  • Terms & conditions
  • •
  • Privacy policy
  • About
  • •
  • Careers
  • •
  • Blog

© 2023 Sorting Hat Technologies Pvt Ltd

Watch Free Classes
    • Free courses
    • JEE Main 2024
    • JEE Main 2024 Live Paper Discussion
    • JEE Main Rank Predictor 2024
    • JEE Main College Predictor 2024
    • Stream Predictor
    • JEE Main 2024 Free Mock Test
    • Study Materials
    • Notifications
    • JEE Advanced Syllabus
    • JEE Books
    • JEE Main Question Paper
    • JEE Coaching
    • Downloads
    • JEE Notes & Lectures
    • JEE Daily Videos
    • Difference Between
    • Full Forms
    • Important Formulas
    • Exam Tips
JEE Main 2026 Preparation: Question Papers, Solutions, Mock Tests & Strategy Unacademy » JEE Study Material » Mathematics » Types of Function Graph

Types of Function Graph

In this article we will cover Types of Function Graph, graphs and functions, characteristics of function graphs, properties of functions etc. There is a connection between a function and its graph. The graph of functions aids in the visualization of the function given in algebraic form. The graph of functions aids in the visualization of the function given in algebraic form.

Table of Content
  •  

A function in mathematics is a specific type of relation with some rules. A function f, for example, is a relation from a non-empty set A to a non-empty set B where the domain of f is A and no two distinct ordered pairs in f have the same first element. Furthermore, we have various types of functions that can be defined based on their properties.

Functions: A function is a relationship between a set of inputs and a set of outputs, with each input being related to exactly one output.

Assume we have the sets P and Q. Mapping from P to Q will be a function only if each element in the set P has only one element from the set Q assigned to it.

Graphs: In mathematics, and more specifically in graph theory, a graph is a structure consisting of a set of objects, some of which are “related” in some way. The objects correspond to mathematical abstractions known as vertices, and each pair of related vertices is known as an edge. A function’s graph is the set of all points in the plane of the form (x, f(x)). The graph of f could also be defined as the graph of the equation y = f. (x). As a result, the graph of a function is a subset of the graph of an equation.

Function types and their graphs

There are several types of algebraic functions, each with its own set of characteristics. Many of these algebraic functions can be identified simply by inspecting their graph.

Depending on the type of function graphed, different types of graphs exist.

  1. Graph of Linear Function

  2. Graph of Squaring Function

  3. Graph of Cubic Function

  4. Graph of  Square Root Function

  5. Graph of Reciprocal Function

  6. Graph of Step Function

  7. Graph of  Piece-Wise Function

1. Graph of Linear Function

All linear functions have the form f(x)=ax+b, where a and b are real numbers and an is nonzero. These functions’ graphs will always be straight lines. This means that the linear function is a first-degree polynomial function:

2. Graph of Squaring Function

A squaring function graph is commonly referred to as a parabola, which is a U-shaped curve. The squaring function f(x) = x2. The diagram is shown below.

Squaring Function Properties

  • The domain of the squaring function is the set of all real numbers corresponding to the x-axis.

  • Because the graph is U-shaped, the squaring function’s range is all non-negative real numbers.

  • Because it is symmetric along the y-axis, the function is an even function.

  • The squaring function’s intercept is at point (0, 0).

  • The squaring function graph has a relative minimum at (0, 0).

3.Graph of Cubic Function

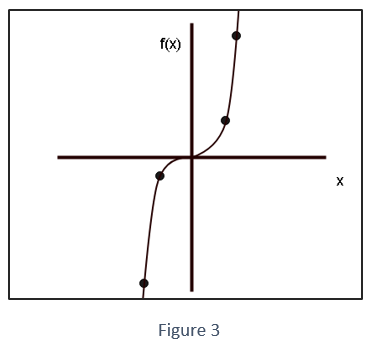
In contrast to the squaring function, the graph of the cubic function has both positive and negative sides. f(x) = x3

The graph of a cubic function looks like this.

Cubic Function Properties

  • The cubic function is a peculiar function.

  • Along the origin, the cubic function is symmetric.

  • Cubic function’s domain is the set of all real numbers.

  • Because the function has an interval between, the range of the cubic function is a set of all real numbers (-∞,∞)

  • The graph’s intercept is located at (0, 0).

4.Graph of Square Root Function

A graph of the function f(x), where x results in x.

f(x) = x 

The squaring function graph is shown below.

As we can see, the graph is only on the positive side for both x and f(x).

Squaring Function Properties

  • The domain consists of a set of non-negative real numbers (0, ∞).

  • The range consists of a collection of non-negative real numbers (0, ∞).

  • The graph’s intercept is located at (0, 0).

  • It rises between the intervals (0,∞).

5. Graph of Reciprocal Function

Let f(x) be a function f(x) = 1x is known as a reciprocal function. The reciprocal graph is shown below.

Although the reciprocal function is symmetric along the origin, it never touches it.

6. Graph of Step Function

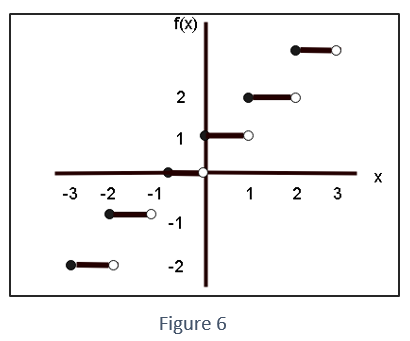
The step function graph resembles a stairwell with steps.

Let f(x) = [[x]] + 1 Denote the step function. [[x]] denotes a value that is ‘greater than or equal to x’.

The step function graph is shown below.

Step Function properties

  • The domain is a collection of all real numbers.

  • The function’s range is a set of all integers.

  • The x-intercept is [0, 1] and the y-intercept is (0, 0).

  • Between each pair of integers, the graph remains constant.

  • For each y-value, the graph jumps one unit vertically.

7. Graph of Piece-Wise Function

Piecewise functions, also known as functions defined by parts, are functions that have different expressions depending on where the independent variable is found in the interval.

When x is greater than or equal to 0, f(x) equals x, and when x is less than 0, f(x) equals -x.The graph of f(x) then has two pieces, one of which corresponds to x (when x is in the interval  (0, ∞) and the other to -x (when x is in the interval  (-∞, 0). 

The Piece-Wise Function is illustrated below.

Conclusion

 In this article we conclude that, Graphing functions is the method of drawing the graph of the corresponding function. Graphing basic functions such as linear, quadratic, cubic, and so on is fairly simple; however, graphing complex functions such as rational, logarithmic, and so on requires some skill and understanding of mathematical concepts. A function’s graph is frequently a useful method of representing the relationship of the function models, and manipulating a mathematical expression for a function can shed light on the function’s properties. Many important phenomena can be modeled using functions presented as expressions.

 
faq

Frequently asked questions

Get answers to the most common queries related to the IIT JEE Examination Preparation.

What exactly is the function?

Ans. A function is a special relation that maps each element of one set to only one element of another set....Read full

How Can You Tell if a Function Is Linear?

Ans. To determine whether a function is linear or not, we must first ensure that the equation is a polynomial of the...Read full

What exactly is a Piecewise Defined Function?

Ans. A piecewise defined function also known as a piecewise function is one that has different definitions for diffe...Read full

Which of the following graphs is a cubic graph?

Ans. A cubic graph is a graph with all vertices having degree three in the mathematical field of graph theory. A cub...Read full

What is the best way to graph a reciprocal function?

Ans. Evaluate the domain of the function, which will also be the location of the vertical asymptote, and then locate...Read full

Ans. A function is a special relation that maps each element of one set to only one element of another set.


Ans. To determine whether a function is linear or not, we must first ensure that the equation is a polynomial of the first degree. This means that when reorganized, the function must have the form f(x)=mx+b, and the independent variable x must have an exponent of 1. We’ll learn more about this through some exercises.

Ans. A piecewise defined function also known as a piecewise function is one that has different definitions for different input intervals.

Ans. A cubic graph is a graph with all vertices having degree three in the mathematical field of graph theory. A cubic graph, in other words, is a three-regular graph. Cubic graphs are also referred to as trivalent graphs.

Ans. Evaluate the domain of the function, which will also be the location of the vertical asymptote, and then locate the horizontal asymptote and create a table of values with some values to the right and some to the left of the vertical asymptote.

Trending Topics

  • JEE Main 2024
  • JEE Main Rank Predictor 2024
  • JEE Main Mock Test 2024
  • JEE Main 2024 Admit Card
  • JEE Advanced Syllabus
  • JEE Preparation Books
  • JEE Notes
  • JEE Advanced Toppers
  • JEE Advanced 2022 Question Paper
  • JEE Advanced 2022 Answer Key
  • JEE Main Question Paper
  • JEE Main Answer key 2022
  • JEE Main Paper Analysis 2022
  • JEE Main Result
  • JEE Exam Pattern
  • JEE Main Eligibility
  • JEE College predictor
combat_iitjee

Related links

  • JEE Study Materials
  • CNG Full Form
  • Dimensional Formula of Pressure
  • Reimer Tiemann Reaction
  • Vector Triple Product
  • Swarts Reaction
  • Focal length of Convex Lens
  • Root mean square velocities
  • Fehling’s solution
testseries_iitjee
Predict your JEE Rank
.
Company Logo

Unacademy is India’s largest online learning platform. Download our apps to start learning


Starting your preparation?

Call us and we will answer all your questions about learning on Unacademy

Call +91 8585858585

Company
About usShikshodayaCareers
we're hiring
BlogsPrivacy PolicyTerms and Conditions
Help & support
User GuidelinesSite MapRefund PolicyTakedown PolicyGrievance Redressal
Products
Learner appLearner appEducator appEducator appParent appParent app
Popular goals
IIT JEEUPSCSSCCSIR UGC NETNEET UG
Trending exams
GATECATCANTA UGC NETBank Exams
Study material
UPSC Study MaterialNEET UG Study MaterialCA Foundation Study MaterialJEE Study MaterialSSC Study Material

© 2026 Sorting Hat Technologies Pvt Ltd

Unacademy
  • Goals
    • AFCAT
    • AP EAMCET
    • Bank Exam
    • BPSC
    • CA Foundation
    • CAPF
    • CAT
    • CBSE Class 11
    • CBSE Class 12
    • CDS
    • CLAT
    • CSIR UGC
    • GATE
    • IIT JAM
    • JEE
    • Karnataka CET
    • Karnataka PSC
    • Kerala PSC
    • MHT CET
    • MPPSC
    • NDA
    • NEET PG
    • NEET UG
    • NTA UGC
    • Railway Exam
    • SSC
    • TS EAMCET
    • UPSC
    • WBPSC
    • CFA

Share via

COPY