Access free live classes and tests on the app
Download
+
Unacademy
  • Goals
    • AFCAT
    • AP EAMCET
    • Bank Exam
    • BPSC
    • CA Foundation
    • CAPF
    • CAT
    • CBSE Class 11
    • CBSE Class 12
    • CDS
    • CLAT
    • CSIR UGC
    • GATE
    • IIT JAM
    • JEE
    • Karnataka CET
    • Karnataka PSC
    • Kerala PSC
    • MHT CET
    • MPPSC
    • NDA
    • NEET PG
    • NEET UG
    • NTA UGC
    • Railway Exam
    • SSC
    • TS EAMCET
    • UPSC
    • WBPSC
    • CFA
Login Join for Free
avtar
  • ProfileProfile
  • Settings Settings
  • Refer your friendsRefer your friends
  • Sign outSign out
  • Terms & conditions
  • •
  • Privacy policy
  • About
  • •
  • Careers
  • •
  • Blog

© 2023 Sorting Hat Technologies Pvt Ltd

Watch Free Classes
    • Free courses
    • JEE Main 2024
    • JEE Main 2024 Live Paper Discussion
    • JEE Main Rank Predictor 2024
    • JEE Main College Predictor 2024
    • Stream Predictor
    • JEE Main 2024 Free Mock Test
    • Study Materials
    • Notifications
    • JEE Advanced Syllabus
    • JEE Books
    • JEE Main Question Paper
    • JEE Coaching
    • Downloads
    • JEE Notes & Lectures
    • JEE Daily Videos
    • Difference Between
    • Full Forms
    • Important Formulas
    • Exam Tips
JEE Main 2026 Preparation: Question Papers, Solutions, Mock Tests & Strategy Unacademy » JEE Study Material » Mathematics » Symmetrical Distribution

Symmetrical Distribution

When the values of variables exist at regular frequencies, a symmetrical distribution is formed, and the mean, median, and mode are frequently found at the same location. A line drawn through the graph's centre reveals two sides that are mirror images of one another.

Table of Content
  •  

Data is a set of facts, usually in the form of numbers such as measurements or statistics. A data set is a collection of information that is commonly represented visually, such as in a table or graph. What exactly does data dispersion imply? The form of a data set when presented on a graph, most commonly a bar graph, is referred to as the distribution of data. A data set’s distribution can take many various forms, including symmetric and skewed. What is the definition of a symmetric data distribution? A symmetric distribution is a data visualization that appears virtually identical on both sides. It’s worth noting that the data doesn’t have to be identical on both sides to be termed symmetric; it only has to be close. Consider a mirror positioned in the midst of data distribution. Both sides should be almost exact replicas of one another.

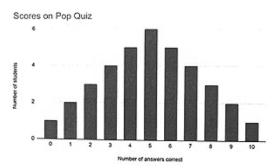
In the example below, a symmetric data distribution is depicted as a symmetric bar graph. The graph depicts the number of questions properly answered on a pop quiz by a hypothetical class of pupils.

The scores, in order from lowest to highest, are 0, 1, 1, 2, 2, 2, 3, 3, 3, 3, 4, 4, 4, 4, 4, 5, 5, 5, 5, 5, 5, 6, 6, 6, 6, 6, 7, 7, 7, 7, 8, 8, 8, 9, 9, 10.The graph’s two sides mirror, or nearly mirror, each other. The graph’s apex is smack dab in the middle. There was almost the same number of pupils who scored above and below the peak. The mean, median, and mode will all occur at the same position in a symmetric data set, which is crucial to know. In a symmetric data collection, the mean, or average, median, or exact middle number, and the mode, or most common number, will all be the same.

Consider the bar graph of the pop quiz results displayed above once again. The data set’s mean, median, and mode all fall on the number 5, indicating a symmetric distribution.

Properties of Symmetric Distributions

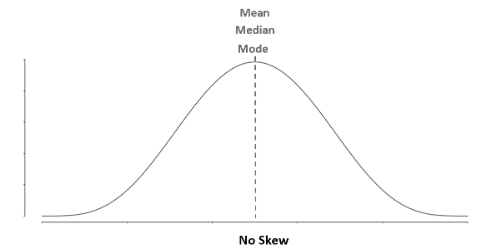
In a symmetrical distribution, the mean, median, and mode are all equal.

Remember the meanings of each of the following terms:

  1. Mean: This is the average of the values.
  2. Median: The value in the midway.
  3. Mode: The value that appears the most frequently.

Each of these numbers is equivalent to the other in a symmetrical distribution.

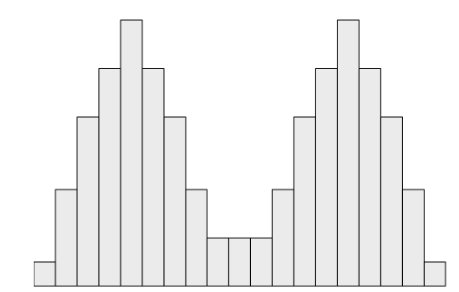
We’ve used unimodal distributions as examples in each of the previous instances – distributions with only one “peak.” A distribution can, however, be bimodal and symmetrical.

A binomial distribution is a distribution that has two peaks.

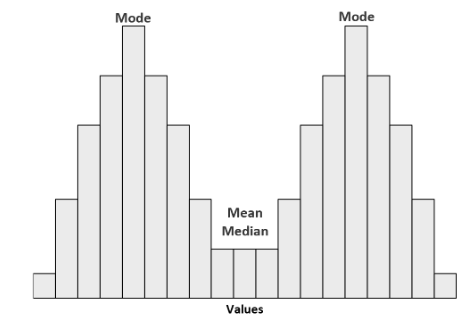
The left and right sides of this distribution would still mirror each other if we drew a line along the middle.

The mean and median of these distributions are the same. The mode, on the other hand, is found between the two peaks.

Symmetric Distributions & The Central Limit Theorem

The central limit theorem, which asserts that if the sample size is high enough, the sampling distribution of a sample mean is nearly normal, even if the population distribution is not normal, is one of the most significant theorems in statistics.

Sufficiently big sample size is required to apply the central limit theorem. The exact figure for “sufficiently big” turns out to be dependent on the underlying form of the population distribution.

Specifically:

  • When the population distribution is symmetric, a sample size of 15 might occasionally be adequate.
  • If the population distribution is skewed, a sample size of at least 30 people is usually required.
  • A sample size of 40 or more may be required if the population distribution is significantly skewed.

As a result, when using the central limit theorem to calculate confidence intervals or perform hypothesis tests, we may use lower sample sizes with symmetric distributions.

Conclusion 

A symmetrical distribution occurs when the values of variables appear at irregular frequencies and the mean, median, and mode appear at distinct locations. Skewness is a property of an asymmetric distribution. When shown on a graph, a Gaussian or normal distribution is curved like a bell curve, and the two sides of the graph are symmetrical.

In contrast to asymmetrical distribution, symmetrical distribution occurs when variable values exist at predictable frequencies and the mean, median, and mode are all present at the same time. A typical example of symmetrical distribution is the bell curve. The left and right sides of the curve would be mirror copies of each other if you drew a line along the centre. A fundamental idea in technical trading, symmetrical distribution posits that an asset’s price movement will follow this distribution curve over time.

faq

Frequently asked questions

Get answers to the most common queries related to the JEE Examination Preparation.

What are the different forms of skewness?

Answer. There are two forms of skewness. There are two forms of skewness: ...Read full

What do you mean by Asymmetrical distribution?

Answer. A symmetrical distribution occurs when the values of variables appear ...Read full

What does a symmetrical distribution look like? Example.

Answer. A symmetrical distribution is exemplified by standardised test scores....Read full

Mean, Median, and Mode: An Overview.

Answer. Mean: The words “mean” and “average” simply refer to the same feature of a data coll...Read full

Answer. There are two forms of skewness. There are two forms of skewness:

Positive Skewness: A distribution is said to be positively skewed if the tail on the right side of the distribution is longer. The mean is bigger than the mode and median in a positively skewed frequency distribution.

Negative Skewness: A frequency distribution is said to be negatively skewed if the tail on the left side is longer or fatter than the tail on the right side. The mean is smaller than the mode and median in a negatively skewed frequency distribution.

Answer. A symmetrical distribution occurs when the values of variables appear at irregular frequencies and the mean, median, and mode appear at distinct locations. Skewness is a property of an asymmetric distribution. When shown on a graph, a Gaussian or normal distribution is curved like a bell curve, and the two sides of the graph are symmetrical.

Answer. A symmetrical distribution is exemplified by standardised test scores. The data set’s mean, median, and mode will all be the same number.

Answer. Mean: The words “mean” and “average” simply refer to the same feature of a data collection. The arithmetic mean is another name for it. Out of the three central trends, the mean or average is favourable to property and one of the most significant, simple, and widely utilised computations. The mean is just the sum of all the values in a set of data after they’ve been divided by the total number of values in the set.

Median: The median is simply the centre – or “mid” – of all the values in the data collection, as the name implies. This illustrates where the data is in the middle. The median of a data set of 5, 10, 15, 20, 25, 15 is, for example.

Mode: A data set’s mode is defined as the value that appears most frequently. The mode is activated when the frequencies in the data keep repeating. This is mostly used to remove the majority of the averages. For example, you could wish to utilise the mode to determine the average of how many students scored the highest.

Crack IIT JEE with Unacademy

Get subscription and access unlimited live and recorded courses from India’s best educators

  • Structured syllabus
  • Daily live classes
  • Ask doubts
  • Tests & practice
Learn more

Notifications

Get all the important information related to the JEE Exam including the process of application, important calendar dates, eligibility criteria, exam centers etc.

Allotment of Examination Centre
JEE Advanced Eligibility Criteria
JEE Advanced Exam Dates
JEE Advanced Exam Pattern 2023
JEE Advanced Syllabus
JEE Application Fee
JEE Application Process
JEE Eligibility Criteria 2023
JEE Exam Language and Centres
JEE Exam Pattern – Check JEE Paper Pattern 2024
JEE Examination Scheme
JEE Main 2024 Admit Card (OUT) – Steps to Download Session 1 Hall Ticket
JEE Main Application Form
JEE Main Eligibility Criteria 2024
JEE Main Exam Dates
JEE Main Exam Pattern
JEE Main Highlights
JEE Main Paper Analysis
JEE Main Question Paper with Solutions and Answer Keys
JEE Main Result 2022 (Out)
JEE Main Revised Dates
JEE Marking Scheme
JEE Preparation Books 2024 – JEE Best Books (Mains and Advanced)
Online Applications for JEE (Main)-2022 Session 2
Reserved Seats
See all

Related articles

Learn more topics related to Mathematics
Zero Vector

A zero vector is defined as a line segment coincident with its beginning and ending points. Primary Keyword: Zero Vector

ZERO MATRIX

In this article, we will discuss about the zero matrix and it’s properties.

YARDS TO FEET

In this article we will discuss the conversion of yards into feet and feets to yard.

XVI Roman Numeral

In this article we are going to discuss XVI Roman Numerals and its origin.

See all
Access more than

10,505+ courses for IIT JEE

Get subscription

Trending Topics

  • JEE Main 2024
  • JEE Main Rank Predictor 2024
  • JEE Main Mock Test 2024
  • JEE Main 2024 Admit Card
  • JEE Advanced Syllabus
  • JEE Preparation Books
  • JEE Notes
  • JEE Advanced Toppers
  • JEE Advanced 2022 Question Paper
  • JEE Advanced 2022 Answer Key
  • JEE Main Question Paper
  • JEE Main Answer key 2022
  • JEE Main Paper Analysis 2022
  • JEE Main Result
  • JEE Exam Pattern
  • JEE Main Eligibility
  • JEE College predictor
combat_iitjee

Related links

  • JEE Study Materials
  • CNG Full Form
  • Dimensional Formula of Pressure
  • Reimer Tiemann Reaction
  • Vector Triple Product
  • Swarts Reaction
  • Focal length of Convex Lens
  • Root mean square velocities
  • Fehling’s solution
testseries_iitjee
Predict your JEE Rank
.
Company Logo

Unacademy is India’s largest online learning platform. Download our apps to start learning


Starting your preparation?

Call us and we will answer all your questions about learning on Unacademy

Call +91 8585858585

Company
About usShikshodayaCareers
we're hiring
BlogsPrivacy PolicyTerms and Conditions
Help & support
User GuidelinesSite MapRefund PolicyTakedown PolicyGrievance Redressal
Products
Learner appLearner appEducator appEducator appParent appParent app
Popular goals
IIT JEEUPSCSSCCSIR UGC NETNEET UG
Trending exams
GATECATCANTA UGC NETBank Exams
Study material
UPSC Study MaterialNEET UG Study MaterialCA Foundation Study MaterialJEE Study MaterialSSC Study Material

© 2026 Sorting Hat Technologies Pvt Ltd

Unacademy
  • Goals
    • AFCAT
    • AP EAMCET
    • Bank Exam
    • BPSC
    • CA Foundation
    • CAPF
    • CAT
    • CBSE Class 11
    • CBSE Class 12
    • CDS
    • CLAT
    • CSIR UGC
    • GATE
    • IIT JAM
    • JEE
    • Karnataka CET
    • Karnataka PSC
    • Kerala PSC
    • MHT CET
    • MPPSC
    • NDA
    • NEET PG
    • NEET UG
    • NTA UGC
    • Railway Exam
    • SSC
    • TS EAMCET
    • UPSC
    • WBPSC
    • CFA

Share via

COPY