Access free live classes and tests on the app
Download
+
Unacademy
  • Goals
    • AFCAT
    • AP EAMCET
    • Bank Exam
    • BPSC
    • CA Foundation
    • CAPF
    • CAT
    • CBSE Class 11
    • CBSE Class 12
    • CDS
    • CLAT
    • CSIR UGC
    • GATE
    • IIT JAM
    • JEE
    • Karnataka CET
    • Karnataka PSC
    • Kerala PSC
    • MHT CET
    • MPPSC
    • NDA
    • NEET PG
    • NEET UG
    • NTA UGC
    • Railway Exam
    • SSC
    • TS EAMCET
    • UPSC
    • WBPSC
    • CFA
Login Join for Free
avtar
  • ProfileProfile
  • Settings Settings
  • Refer your friendsRefer your friends
  • Sign outSign out
  • Terms & conditions
  • •
  • Privacy policy
  • About
  • •
  • Careers
  • •
  • Blog

© 2023 Sorting Hat Technologies Pvt Ltd

Watch Free Classes
    • Free courses
    • JEE Main 2024
    • JEE Main 2024 Live Paper Discussion
    • JEE Main Rank Predictor 2024
    • JEE Main College Predictor 2024
    • Stream Predictor
    • JEE Main 2024 Free Mock Test
    • Study Materials
    • Notifications
    • JEE Advanced Syllabus
    • JEE Books
    • JEE Main Question Paper
    • JEE Coaching
    • Downloads
    • JEE Notes & Lectures
    • JEE Daily Videos
    • Difference Between
    • Full Forms
    • Important Formulas
    • Exam Tips
JEE Main 2026 Preparation: Question Papers, Solutions, Mock Tests & Strategy Unacademy » JEE Study Material » Mathematics » Standard Error of the Mean

Standard Error of the Mean

The standard error is a statistical method used to determine variability in statistics. It allows one to estimate the standard deviation of a particular sample. SE is the abbreviated form of the term. Let us know the meaning of standard error in detail.

Table of Content
  •  

When we take samples from a population and calculate their means, the means are organized into a distribution around the real population mean. The standard error is the standard deviation of this distribution of sampling means. The standard error measures how closely a sample’s mean corresponds to the population’s true mean. With a bigger standard error, the means are more spread out, and your sample mean is more likely to be an inaccurate reflection of the underlying population mean. A smaller standard error, on the other hand, implies that the means are closer together, and thus your sample mean is more likely to be an accurate depiction of the underlying population mean.

Meaning of Standard Error of the Mean and Standard Deviation

The standard deviation (SD) of a dataset is a measure of its dispersion to its mean. The standard error of the mean (SEM) is a measurement of how far a sample’s mean differs from the population mean. The SD is divided by the square root of the sample size in the SEM.

The standard deviation is divided by the square root of the random sample to produce the standard error of the mean (SEM). The standard error of the mean is calculated by determining the sample-to-sample deviation of the sample means. 

The SEM indicates how accurate the sample mean is as an estimate of the population’s true mean. As the sample size grows higher, the SEM reduces compared to the standard deviation; thus, as the sample size expands, the sample mean more accurately estimates the population’s true mean. Increasing the sample size, on the other hand, does not always make the SD larger or smaller; it simply becomes a more accurate assessment of the population SD.
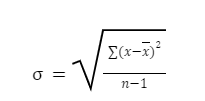
The formula required to determine the standard error of the mean

  • Standard Deviation

Where σ = Lower case sigma is the symbol for standard deviation

Σ = Upper case sigma is the summation symbol

x = Each value in the data set

x̅ = The arithmetic mean (known as “x-bar”)

n = The number of data points in the set (the number of X values)

  • Standard Error (SE)

s/√n

Where S= sample SD

n= number of observations in the sample

  • Standard Error of Mean (SEM)

σM=  σ/√n

Where M = sample mean

n= sample size

Therefore, Standard Error of Mean = Ratio of the Standard Deviation to the square root of the sample size.

  • SEM = Standard Deviation/ √samplesize(n)

Steps to determine the Standard Error of the Mean:

  1. To get the standard error of the mean, use the formula M =/N. M stands for the standard error of the mean, which is the number you’re looking for,, for the standard deviation of the original distribution, and N for the square of the sample size in this method.

  2. Calculate the original distribution’s standard deviation. The standard deviation simply indicates how far the numbers on the number line are apart.

  3. If the standard deviation is not given, find the mean of the set of numbers by adding all the numbers together and then dividing that sum by the number of items that are included. 

  4. Subtract the mean from each of the starting numbers and square the answers.

  5. The next step is to calculate the average of this new set of numbers; the result will give the variance. 

  6. The standard deviation is then calculated by squaring the variance. Here, we will substitute the number for the symbol.

  7. Calculate the sample size. The sample size refers to how many objects or observations you have to deal with.

  8. Substitute your sample size for N in the formula.

  9. Calculate the square root of the sample size.

  10. Subtract the square root of the sample size from the standard deviation. The standard error of the mean will be calculated as a result of the answer.

Conditions for determining the standard error of the mean:

  • When calculating the standard error of a mean, the most crucial assumption is that the observations are similarly likely to be acquired and are independent. To put it another way, the sample should have been gathered through random sampling or allocation.

  • Although the standard error of the mean can be calculated for any type of variable, it is most useful for measurement variables (continuous or discrete) and binary variables.

  • It can be calculated for any form of frequency distribution, however, like the standard deviation, it is expected to be distributed symmetrically for most of the tasks it is used for.

  • The standard error of the mean is frequently used in scientific data reporting. It’s a good estimate for the variability of our mean estimate, but not for the variability of the data.

  • It can also be used as an indirect measure of the dependability of our estimate of the mean if the sample size is large enough and it is a random sample from the population.

Conclusion

All forms of statistical research, including those in accounting, medicine, science, technology, and psychiatry, use standard deviation and standard error. The SD and estimated SEM are used in this research to illustrate sample data characteristics and explain statistical analysis results. The SD and the SEM are sometimes confused by researchers. Such researchers should keep in mind that the SD and SEM estimates involve a variety of statistical judgments, each with its meaning. SD stands for the standard deviation of individual data values. Standard Deviation evaluates how well the mean resembles the sample data. Statistical inference based on the sampling distribution is included in the meaning of the standard error of the mean. The SEM is the standard deviation of the sample mean theoretical distribution.

faq

Frequently asked questions

Get answers to the most common queries related to the IIT JEE Examination Preparation.

How do we determine the standard error of the mean?

Ans : The standard deviation is divided by the square root of the sample size to calculate the SEM. The standard error of a sample...Read full

What is the significance of knowing the standard error of the mean?

Ans : The standard error of the mean can give you an approximate idea of where the population mean is most likely to fall. The SEM...Read full

What is the difference between standard deviation and standard error?

Ans : Both standard deviation and standard error are measurements of variability. The standard deviation measures the variability ...Read full

What is the definition of a high standard error of the mean?

Ans : A high standard error indicates that sample means are widely distributed around the population mean, implying that your samp...Read full

Ans : The standard deviation is divided by the square root of the sample size to calculate the SEM. The standard error of a sample mean is calculated by calculating the sample-to-sample variability of the sample mean.


Ans : The standard error of the mean can give you an approximate idea of where the population mean is most likely to fall. The SEM is multiplied by 1.96, just as the standard deviation, to get an estimate of where 95 percent of the population sample means should fall in the theoretical sampling distribution.


Ans : Both standard deviation and standard error are measurements of variability. The standard deviation measures the variability within a sample, whereas the standard error measures variability across population samples.

Ans : A high standard error indicates that sample means are widely distributed around the population mean, implying that your sample may not accurately reflect your population. A low standard error indicates that sample means are evenly spread around the population mean, indicating that your sample is representative of the entire population.

Crack IIT JEE with Unacademy

Get subscription and access unlimited live and recorded courses from India’s best educators

  • Structured syllabus
  • Daily live classes
  • Ask doubts
  • Tests & practice
Learn more

Notifications

Get all the important information related to the JEE Exam including the process of application, important calendar dates, eligibility criteria, exam centers etc.

Allotment of Examination Centre
JEE Advanced Eligibility Criteria
JEE Advanced Exam Dates
JEE Advanced Exam Pattern 2023
JEE Advanced Syllabus
JEE Application Fee
JEE Application Process
JEE Eligibility Criteria 2023
JEE Exam Language and Centres
JEE Exam Pattern – Check JEE Paper Pattern 2024
JEE Examination Scheme
JEE Main 2024 Admit Card (OUT) – Steps to Download Session 1 Hall Ticket
JEE Main Application Form
JEE Main Eligibility Criteria 2024
JEE Main Exam Dates
JEE Main Exam Pattern
JEE Main Highlights
JEE Main Paper Analysis
JEE Main Question Paper with Solutions and Answer Keys
JEE Main Result 2022 (Out)
JEE Main Revised Dates
JEE Marking Scheme
JEE Preparation Books 2024 – JEE Best Books (Mains and Advanced)
Online Applications for JEE (Main)-2022 Session 2
Reserved Seats
See all

Related articles

Learn more topics related to Mathematics
Zero Vector

A zero vector is defined as a line segment coincident with its beginning and ending points. Primary Keyword: Zero Vector

ZERO MATRIX

In this article, we will discuss about the zero matrix and it’s properties.

YARDS TO FEET

In this article we will discuss the conversion of yards into feet and feets to yard.

XVI Roman Numeral

In this article we are going to discuss XVI Roman Numerals and its origin.

See all
Access more than

10,505+ courses for IIT JEE

Get subscription

Trending Topics

  • JEE Main 2024
  • JEE Main Rank Predictor 2024
  • JEE Main Mock Test 2024
  • JEE Main 2024 Admit Card
  • JEE Advanced Syllabus
  • JEE Preparation Books
  • JEE Notes
  • JEE Advanced Toppers
  • JEE Advanced 2022 Question Paper
  • JEE Advanced 2022 Answer Key
  • JEE Main Question Paper
  • JEE Main Answer key 2022
  • JEE Main Paper Analysis 2022
  • JEE Main Result
  • JEE Exam Pattern
  • JEE Main Eligibility
  • JEE College predictor
combat_iitjee

Related links

  • JEE Study Materials
  • CNG Full Form
  • Dimensional Formula of Pressure
  • Reimer Tiemann Reaction
  • Vector Triple Product
  • Swarts Reaction
  • Focal length of Convex Lens
  • Root mean square velocities
  • Fehling’s solution
testseries_iitjee
Predict your JEE Rank
.
Company Logo

Unacademy is India’s largest online learning platform. Download our apps to start learning


Starting your preparation?

Call us and we will answer all your questions about learning on Unacademy

Call +91 8585858585

Company
About usShikshodayaCareers
we're hiring
BlogsPrivacy PolicyTerms and Conditions
Help & support
User GuidelinesSite MapRefund PolicyTakedown PolicyGrievance Redressal
Products
Learner appLearner appEducator appEducator appParent appParent app
Popular goals
IIT JEEUPSCSSCCSIR UGC NETNEET UG
Trending exams
GATECATCANTA UGC NETBank Exams
Study material
UPSC Study MaterialNEET UG Study MaterialCA Foundation Study MaterialJEE Study MaterialSSC Study Material

© 2026 Sorting Hat Technologies Pvt Ltd

Unacademy
  • Goals
    • AFCAT
    • AP EAMCET
    • Bank Exam
    • BPSC
    • CA Foundation
    • CAPF
    • CAT
    • CBSE Class 11
    • CBSE Class 12
    • CDS
    • CLAT
    • CSIR UGC
    • GATE
    • IIT JAM
    • JEE
    • Karnataka CET
    • Karnataka PSC
    • Kerala PSC
    • MHT CET
    • MPPSC
    • NDA
    • NEET PG
    • NEET UG
    • NTA UGC
    • Railway Exam
    • SSC
    • TS EAMCET
    • UPSC
    • WBPSC
    • CFA

Share via

COPY