In Stats, the term Pearson’s correlation coefficient is defined as a statistical measure to show how strong a linear relationship between two sets of data is. It is designated by the letter r in a sample and is constrained by design in the following way:
-1≤r≤1
- In addition, the positive values indicate positive linear correlation whereas the negative values indicate negative linear correlation; a value of 0 indicates no linear correlation. As, the closer the value is to 1 or –1, the higher the linear correlation.
In case of correlated data, a change in one variable’s magnitude is linked to a change in another variable’s magnitude, either in the same (positive correlation) or opposite (negative correlation) direction.
- Correlation is most commonly used to describe a linear relationship between two continuous variables, which is written as Pearson product-moment correlation.
- For jointly normally distributed data, the Pearson correlation coefficient is commonly utilised (data that follow a bivariate normal distribution).
- A monotonic relationship is a subtype of a linear relationship between two variables. The term “correlation” is most typically used in the context of a Pearson product-moment correlation, which is commonly abbreviated as “r.”
- The covariance of the variables can be used to mathematically explain the degree to which a change in one continuous variable is associated with a change in another continuous variable.
Importance of Pearson Correlation Coefficient
The Pearson correlation coefficient is a useful statistical calculation for determining the strength of correlations between variables. This formula is commonly referred to as the Pearson R test in the field of statistics. It’s a good idea to use a Pearson correlation coefficient value when running a statistical test between two variables to see how strong the association is.
Value of r:
Perfect Negative Correlation
r= -1
No Correlation
r= 0
Perfect Positive Correlation
r=1
- When r =1, we state we have perfect correlation, we mean that the points are all in a straight line.
Note
- Because the correlation coefficient is a measure of linear relationship, a value of does not mean that the variables are unrelated.
- The correlation coefficient has nothing to do with the gradient except to share its +ve or –ve sign!
Pearson Correlation is an effect size, also verbally. In turn, it describe the strength of the correlation, using Evans’ (1996) guide for determining the absolute value of ‘r’:
- 0.00-0.19: Very Weak
- 0.20-0.39: Weak
- 0.40-0.59 : Moderate
- 0.60-0.79 : Strong
- 0.80-1.0 : Very strong
For example,
The correlation value of absolute ‘r’= 0.44, would be a moderate positive correlation.
- The following data assumptions must apply for the calculation of Pearson’s correlation coefficient and subsequent significance testing of it:
- Interval or ratio level
- Linearly related
- Bivariate normally distributed
- In practice, the last assumption is verified by requiring both variables to be normally distributed independently (which is a by-product consequence of bivariate normality). Pearson’s correlation coefficient is sensitive to the skewed distributions and outliers, thus we are satisfied if we do not have these criteria.
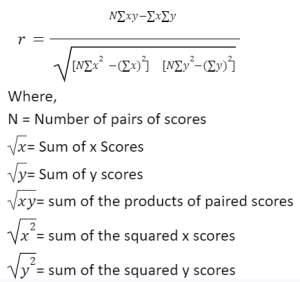
Formula of Pearson coefficient correlation
A formula must be followed to get the coefficient value, which is used to determine how strong the association between two variables is. The value of the coefficient might be anything between -1.00 and 1.00. If the coefficient value is negative, the relationship between the variables is negatively correlated, which means that as one value rises, the other falls. If the value is in the positive range, the relationship between the variables is positively correlated, which implies that both values rise or fall at the same time.
Formula of Pearson Coefficient Correlation:

Conclusion
A measure of a monotonic association between two variables is termed as correlation. A monotonic relationship between two variables is one in which the value of one variable increases with the value of the other variable, or the value of one variable decreases in with the value of the other variable. As a result, with correlated data, a change in the magnitude of one variable is linked to a change in the magnitude of another variable, either in the same direction or in the opposite direction. In other words, higher values of one variable are linked to higher (positive correlation) or lower (negative correlation) values of the other variable, and vice versa.
 Profile
 Settings
 Refer your friends
 Sign out


