The median is the middlemost data for an odd number of data, and the average of the two middle values for an even amount of data.
Median is one among the three central tendencies. When describing a set of data, the data set’s centre position is determined. This is referred to as the central tendency measure. The mean, median, and mode are three most popular metrics of central tendency. For each group, the median is the value in the middle. It’s where half of the data is more and half of the data is less. The median is the most straightforward statistical measure to evaluate from the data. The data must be sorted in the format of ascending order to calculate the median, and the middlemost data point is the data’s median. Furthermore, the quantity of data points affects the estimation of the median.
Sometimes it is difficult to find all of the data for representation, hence the median comes in use. The median is a simple metric to evaluate among the statistical summary metrics.
Let us take a look at some of the examples of determining the median for a set of data.
Step 1: Think about the numbers: 5,15,3,12and 1. Let’s put this information in ascending order: 1,3,5,12,15and so on.
Step 2: Count how many values there are. Five possible values are there.
Step 3: Then find the middle value. median is the middle value. Therefore, median = 5.
Median formula: The middle value of the arranged group of numbers can be computed using the median formula. The median formula can be changed depending on how many observations in the dataset there are and whether they are odd or even. The formulas help to find the median of the provided data.
Step1: Arrange the data in ascending order.
Step 2: No, Count the number of observations, which is ‘n’.
Step 3: Determine whether ‘n’ is an even or odd number of observations.
Median = [(n + 1)/2]
Median = [(n / 2)th term + (( n / 2 ) + 1)th term]/2
The median is found using the procedures below when the data is continuous and in the form of a frequency distribution.
Step 1: Count the total observations there are in total (n).
Step 2: Determine the class size(h) and divide the data into groups.
Step 3: Compute each class’s cumulative frequency.
Step 4: find which class the median belongs to.
Step 5: Determine the median class(lower)’s limit as well as the cumulative frequency of the class preceding the median class (c).
To find the median value, apply the formula below.
Median= l+[(n/2-c)/f] × c
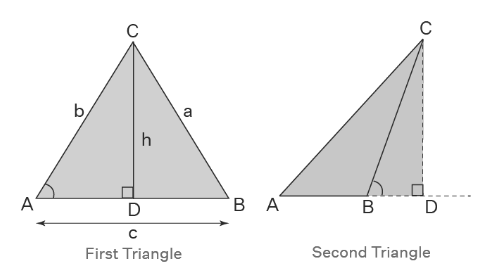
In the first triangle we have: h/b = sinA
⇒ h = b sinA
In the second triangle we have: h/a = sinB
⇒ h = a sinB
Additionally, sin(180o – B) = sinB.
By equating the h values in the preceding formulas, we obtain:
a sinB = b sinA
⇒ a/sinA = b/sinB
Likewise, we can infer a relationship between sin A and sin C.
asinC = csinA
⇒ a/sinA = c/sinC
By combining the two formulas above, we obtain the sine law shown below.
a/sinA = b/sinB = c/sinC
The law of sines is useful for determining the missing side or angle of a triangle when all other necessary data is available. The sine law may be used to determine the following:
Both the law of sines and the law of cosines are used to determine an unknown angle or side of a triangle. Let us examine the distinction between the two laws.
It is utilized when we are given two angles and a side, or when we are given two sides and an included angle.
It is employed when we are given three sides or two sides plus an angle.
When two angles and a side are known, the rule of sines may be used to compute the remaining sides of a triangle—a process known as triangulation. Additionally, it may be employed when two sides and one of the open angles are known.



 Profile
 Settings
 Refer your friends
 Sign out