Access free live classes and tests on the app
Download
+
Unacademy
  • Goals
    • AFCAT
    • AP EAMCET
    • Bank Exam
    • BPSC
    • CA Foundation
    • CAPF
    • CAT
    • CBSE Class 11
    • CBSE Class 12
    • CDS
    • CLAT
    • CSIR UGC
    • GATE
    • IIT JAM
    • JEE
    • Karnataka CET
    • Karnataka PSC
    • Kerala PSC
    • MHT CET
    • MPPSC
    • NDA
    • NEET PG
    • NEET UG
    • NTA UGC
    • Railway Exam
    • SSC
    • TS EAMCET
    • UPSC
    • WBPSC
    • CFA
Login Join for Free
avtar
  • ProfileProfile
  • Settings Settings
  • Refer your friendsRefer your friends
  • Sign outSign out
  • Terms & conditions
  • •
  • Privacy policy
  • About
  • •
  • Careers
  • •
  • Blog

© 2023 Sorting Hat Technologies Pvt Ltd

Watch Free Classes
    • Free courses
    • JEE Main 2024
    • JEE Main 2024 Live Paper Discussion
    • JEE Main Rank Predictor 2024
    • JEE Main College Predictor 2024
    • Stream Predictor
    • JEE Main 2024 Free Mock Test
    • Study Materials
    • Notifications
    • JEE Advanced Syllabus
    • JEE Books
    • JEE Main Question Paper
    • JEE Coaching
    • Downloads
    • JEE Notes & Lectures
    • JEE Daily Videos
    • Difference Between
    • Full Forms
    • Important Formulas
    • Exam Tips
JEE Main 2026 Preparation: Question Papers, Solutions, Mock Tests & Strategy Unacademy » JEE Study Material » Mathematics » Mean Median Mode

Mean Median Mode

In the following article we are going to know about the mean, and median and mode, the uses in detail.

Table of Content
  •  

Mathematical statistics distinguishes three forms of “averages”: mean, median, and mode. There are many “averages” in statistics, but these are the three most common and likely to be encountered in pre-statistics classes.

The mean, median, and mode can be distinguished as follows:

In statistics, the mean, the median, and the mode are all used to show the central tendency. They tell us in various ways what value in a data set is typical or indicative of the data set.

  • Mean

A computation is used to determine the mean, often known as the average value of a data collection. The total number of numbers in the data set divided by the total number of numbers in the data set

  • Median

The median is the number in the center of a data collection. Find the Center number by arranging the data points in ascending order. This is the halfway point. The median is the average of two values that are in the center.

  • Mode

The mode is the most occurring number in a data collection. We must count how many times each number appears in the data. The mode is the number with the highest frequency. It is OK if there are many modes. If all numbers are repeated  then there is no mode.

How to Find the Mean

  • Add up all of the data values to obtain the total
  • And then, Count the number of values in your data set
  • After that, Divide the total by the number of people
  • The mean of a data collection relates to the average value

Mean Calculation Formula

The mean x of a data collection is the sum of all the data divided by the count n.

i.e mean of the observation

How to Calculate the Median

The median x~ is the data value that separates the upper and bottom halves of a data set.

  • Firstly, we have to arrange the data values in ascending order from lowest to highest
  • The data value in the middle of the set is called the median
  • The median of two data values in the Center is the mean of the two numbers

How to Determine Mode

A data mode is the value that appears the most frequently in the presented data, i.e. the observation with the greatest frequency.

Case 1: Data that has not been categorized

For ungrouped data, we just need to determine the most frequent observation. Mode refers to data with the greatest frequency.

For example, the number 6 appears the most in the following data: 6, 8, 9, 3, 4, 6, 7, 6, 3. As a consequence, mode equals 6. The following is a straightforward method for remembering mode: The most frequently entered information. It is important to note that a datum might have no mode, one mode, or numerous modes. Depending on the number of modes, the data can be classed as unimodal, bimodal, trimodal, or multimodal. Because it just has one mode, the offered example is unimodal.

Case 2: Grouped Data

The following procedures can be used to identify the mode when the data is continuous:

Step 1: Identify the modal class, or the class with the highest frequency of occurrence.

Step 2: To determine mode, apply the following formula:

   Mode =  where,

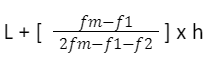
  • l = lower limit of the given set,
  • fm is frequency the given set,
  • f1 is frequency of the given set,
  • f2 is frequency of the given set,
  • h is the class width.

All the three measures of central values, namely mean, median and mode are related (called an empirical relationship).

{ 3 Median } = 2 Mean  + Mode

For example, if we are asked to determine the mean, median, and mode of continuous grouped data, we may apply the formulae given in the prior sections to obtain the mean and the median, and then use the empirical relation to find the value of mode for given data.

If we have data with a mode of 45 and a median of 35.2, we can find the mean using the previously described mean, median, and mode relations.

2mean + mode = 3 median Or, 2mean = 3 x 35.2 – 45 Or, 2mean = 60.6 Or, mean = 60.6 / 2 = 20.3

Conclusion:

 The arithmetic mean is calculated by adding the numbers and dividing the total by the total number of numbers in the list. This is what most people mean when they say “average.” The median is the value in the center of a list that is sorted from least to biggest. The mode value appears the most frequently on the list.

faq

Frequently asked questions

Get answers to the most common queries related to the IIT JEE Examination Preparation.

What Do the Terms Mean, Mode, and Median?

Ans : In mathematical statistics, three measures of central t...Read full

What is the distinction between mean, median, and mode in statistics?

Ans : The terms mean, median, and mode refer to statistical m...Read full

What is the definition of Mode?

Ans : The mode is defined as the value or number that appears the most frequently in a dataset. The...Read full

Do you want to write down the definition of Median?

Ans : The median is one of the three measurements of central ...Read full

What is the definition of mean?

Ans: The term “mean” refers to a statistical concept that has a wide range of applications in fi...Read full

Ans : In mathematical statistics, three measures of central tendency are defined: mean, mode, and median. The median is the value of the middlemost observation obtained after organizing the data in ascending or descending order, whereas the mean is the average value of the given collection of data. The most frequent value is indicated by mode. It tells you which value appears the most frequently in the data. The mode in any given bar chart is the highest or largest bar. It is used with categorical data, such as the most common size of a T-shirt sold.


Ans : The terms mean, median, and mode refer to statistical measures of central tendency or distinct sorts of averages. The mean is the “average,” which is found by adding all of the numbers together and then dividing by the number of numbers, whereas the median is the value in the list that is “middle.”


Ans : The mode is defined as the value or number that appears the most frequently in a dataset. The mode is one of the values of the measurements of central tendency. This number provides an estimate of which elements in a data collection are most likely to occur.

Ans : The median is one of the three measurements of central tendency. The Center location of a data collection is established while describing it. This is known as the set’s central tendency measure.

The value of the middle-most observation obtained after arranging the data in ascending order is the value of the provided data’s median.

Ans: The term “mean” refers to a statistical concept that has a wide range of applications in finance and is used in a number of financial fields, including corporate valuation. The mean, median, and mode are the three statistical measures of data central tendency.

Crack IIT JEE with Unacademy

Get subscription and access unlimited live and recorded courses from India’s best educators

  • Structured syllabus
  • Daily live classes
  • Ask doubts
  • Tests & practice
Learn more

Notifications

Get all the important information related to the JEE Exam including the process of application, important calendar dates, eligibility criteria, exam centers etc.

Allotment of Examination Centre
JEE Advanced Eligibility Criteria
JEE Advanced Exam Dates
JEE Advanced Exam Pattern 2023
JEE Advanced Syllabus
JEE Application Fee
JEE Application Process
JEE Eligibility Criteria 2023
JEE Exam Language and Centres
JEE Exam Pattern – Check JEE Paper Pattern 2024
JEE Examination Scheme
JEE Main 2024 Admit Card (OUT) – Steps to Download Session 1 Hall Ticket
JEE Main Application Form
JEE Main Eligibility Criteria 2024
JEE Main Exam Dates
JEE Main Exam Pattern
JEE Main Highlights
JEE Main Paper Analysis
JEE Main Question Paper with Solutions and Answer Keys
JEE Main Result 2022 (Out)
JEE Main Revised Dates
JEE Marking Scheme
JEE Preparation Books 2024 – JEE Best Books (Mains and Advanced)
Online Applications for JEE (Main)-2022 Session 2
Reserved Seats
See all

Related articles

Learn more topics related to Mathematics
Zero Vector

A zero vector is defined as a line segment coincident with its beginning and ending points. Primary Keyword: Zero Vector

ZERO MATRIX

In this article, we will discuss about the zero matrix and it’s properties.

YARDS TO FEET

In this article we will discuss the conversion of yards into feet and feets to yard.

XVI Roman Numeral

In this article we are going to discuss XVI Roman Numerals and its origin.

See all
Access more than

10,505+ courses for IIT JEE

Get subscription

Trending Topics

  • JEE Main 2024
  • JEE Main Rank Predictor 2024
  • JEE Main Mock Test 2024
  • JEE Main 2024 Admit Card
  • JEE Advanced Syllabus
  • JEE Preparation Books
  • JEE Notes
  • JEE Advanced Toppers
  • JEE Advanced 2022 Question Paper
  • JEE Advanced 2022 Answer Key
  • JEE Main Question Paper
  • JEE Main Answer key 2022
  • JEE Main Paper Analysis 2022
  • JEE Main Result
  • JEE Exam Pattern
  • JEE Main Eligibility
  • JEE College predictor
combat_iitjee

Related links

  • JEE Study Materials
  • CNG Full Form
  • Dimensional Formula of Pressure
  • Reimer Tiemann Reaction
  • Vector Triple Product
  • Swarts Reaction
  • Focal length of Convex Lens
  • Root mean square velocities
  • Fehling’s solution
testseries_iitjee
Predict your JEE Rank
.
Company Logo

Unacademy is India’s largest online learning platform. Download our apps to start learning


Starting your preparation?

Call us and we will answer all your questions about learning on Unacademy

Call +91 8585858585

Company
About usShikshodayaCareers
we're hiring
BlogsPrivacy PolicyTerms and Conditions
Help & support
User GuidelinesSite MapRefund PolicyTakedown PolicyGrievance Redressal
Products
Learner appLearner appEducator appEducator appParent appParent app
Popular goals
IIT JEEUPSCSSCCSIR UGC NETNEET UG
Trending exams
GATECATCANTA UGC NETBank Exams
Study material
UPSC Study MaterialNEET UG Study MaterialCA Foundation Study MaterialJEE Study MaterialSSC Study Material

© 2026 Sorting Hat Technologies Pvt Ltd

Unacademy
  • Goals
    • AFCAT
    • AP EAMCET
    • Bank Exam
    • BPSC
    • CA Foundation
    • CAPF
    • CAT
    • CBSE Class 11
    • CBSE Class 12
    • CDS
    • CLAT
    • CSIR UGC
    • GATE
    • IIT JAM
    • JEE
    • Karnataka CET
    • Karnataka PSC
    • Kerala PSC
    • MHT CET
    • MPPSC
    • NDA
    • NEET PG
    • NEET UG
    • NTA UGC
    • Railway Exam
    • SSC
    • TS EAMCET
    • UPSC
    • WBPSC
    • CFA

Share via

COPY