Access free live classes and tests on the app
Download
+
Unacademy
  • Goals
    • AFCAT
    • AP EAMCET
    • Bank Exam
    • BPSC
    • CA Foundation
    • CAPF
    • CAT
    • CBSE Class 11
    • CBSE Class 12
    • CDS
    • CLAT
    • CSIR UGC
    • GATE
    • IIT JAM
    • JEE
    • Karnataka CET
    • Karnataka PSC
    • Kerala PSC
    • MHT CET
    • MPPSC
    • NDA
    • NEET PG
    • NEET UG
    • NTA UGC
    • Railway Exam
    • SSC
    • TS EAMCET
    • UPSC
    • WBPSC
    • CFA
Login Join for Free
avtar
  • ProfileProfile
  • Settings Settings
  • Refer your friendsRefer your friends
  • Sign outSign out
  • Terms & conditions
  • •
  • Privacy policy
  • About
  • •
  • Careers
  • •
  • Blog

© 2023 Sorting Hat Technologies Pvt Ltd

Watch Free Classes
    • Free courses
    • JEE Main 2024
    • JEE Main 2024 Live Paper Discussion
    • JEE Main Rank Predictor 2024
    • JEE Main College Predictor 2024
    • Stream Predictor
    • JEE Main 2024 Free Mock Test
    • Study Materials
    • Notifications
    • JEE Advanced Syllabus
    • JEE Books
    • JEE Main Question Paper
    • JEE Coaching
    • Downloads
    • JEE Notes & Lectures
    • JEE Daily Videos
    • Difference Between
    • Full Forms
    • Important Formulas
    • Exam Tips
JEE Main 2026 Preparation: Question Papers, Solutions, Mock Tests & Strategy Unacademy » JEE Study Material » Mathematics » How to Construct a Function Graph?

How to Construct a Function Graph?

In this article we will cover Construction of a Function Graph, Steps to graph a function, Steps to graph a function. Graphing functions is the process of drawing a curve that represents a function on a coordinate plane. If a function is represented by a curve, then every point on the curve satisfies the function equation.

Table of Content
  •  

Graphing functions is the way of generating a curve that represents a function on a coordinate plane. If a function is represented by a graph, then every point on the curve satisfies the function equation. A function’s graph is frequently a useful method of representing the relation of the function models, and trying to manipulate a mathematical expression for a function can shed light on the function’s properties. Many essential phenomena can be modelled using functions presented as expressions.

Steps to graph a function

When graphing functions, we take the following steps:

  • Find the function’s domain and range and keep them in mind as you draw the curve.

  • Find and plot the x-intercept(s) and y-intercept(s).

  • Determine whether or not there are any holes.

  • Find the asymptotes vertical, horizontal, and slant and draw dotted lines to break the graph along those lines and ensure that the graph does not touch them.

  • Create a table of values by taking some random x values (on both sides of the x-intercept and on both sides of the vertical asymptote) and calculating the corresponding y values.

  • Plot the points from the table and connect those using asymptotes, domain, and range.

Constructing a basic function graph

Basic function graph

The basic concept of graphing functions is

  • If possible, identify the shape. If it is a linear function of the form f(x) = ax+ b, its graph is a line; if it is a quadratic function of the form . Its graph is a parabola.

  • locating some points on it by substituting some random x values and locating the corresponding y values by substituting each value into the function

For example

This section graphs seven fundamental functions that will be used throughout the course. Plotting points is used to graph each function. Keep in mind that f(x)=y, so f(x) and y can be used interchangeably.

A constant function is any function of the form f(x)=c, where c can be any real number. Constant functions are linear and have the form f(x)=0x+c. It is clear from this form that the slope is 0 and the y-intercept is (0,c). c is obtained by evaluating any value for x, such as x=2.

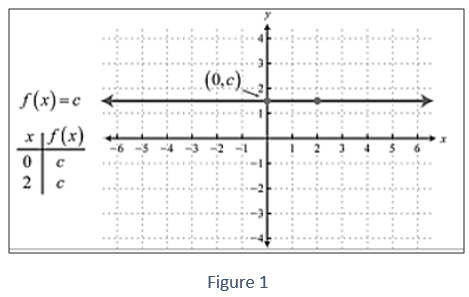
The graph of a constant function is a horizontal line. The domain is made up of all real numbers R, and the range is made up of a single value c.

Identifying functions using graphs

We will use two tests to identify functions using graphs. If a horizontal line intersects the curve more than once at some point, the curve lacks an inverse function. In short, if you have a curve, the vertical line test determines whether or not it is a function, and the horizontal line test determines whether or not the inverse of that curve is a function.

Vertical line test

The vertical line test can be used to determine whether a graph represents a function. A vertical line connects all points with the same x value. The y value of a point on a graph where a vertical line intersects it represents an output for that input x value. If any vertical line intersects a graph more than once, the graph does not define a function because that x value has more than one output. For each input value, a function produces only one output value.

If, on the other hand, the vertical line intersects the graph more than once, it indicates that a single x-value is associated with more than one y value. This condition results in the relation being “disqualified,” or not being considered as a function.

Horizontal Line Test

Once we have determined that a graph defines a function, we can use the horizontal line test to see if it’s a one-to-one function. Make horizontal lines across the graph. A horizontal line connects all points with the same y value. The input for that output y value is the x value of a point where a vertical line intersects a function. If any horizontal line intersects a graph more than once, the graph does not represent a function because that y value has more than one input.

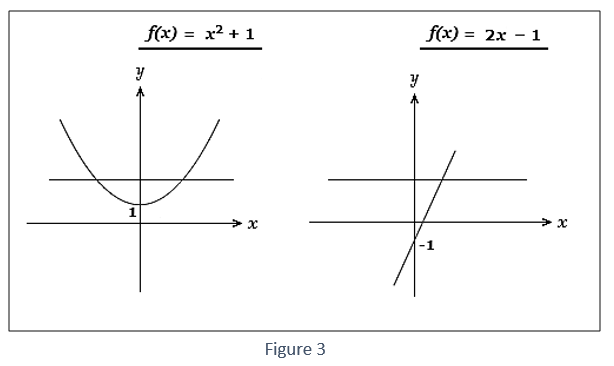
Use of Horizontal Line Test

For x R, the graphs of f(x) = x2 + 1 and f(x) = 2x – 1 are shown below.

Conclusion

In this article we conclude that, The process of drawing the graph of the corresponding function is known as graphing functions. The graph of a function is extremely useful. We may not always know the expression for a function, but we do know some of its values maybe from an experiment. The graph can give us a good idea of what function could be used to solve the problem. And for identifying functions using graphs we will perform a vertical line test that determines whether the curve is a function, and the horizontal line test determines whether the curve’s inverse is a function.

faq

Frequently asked questions

Get answers to the most common queries related to the JEE Examination Preparation.

How to Draw Graphs of Functions.

Ans. For graphing functions, we must construct a table of values and plot its asymptotes, xand y-intercepts, holes, ...Read full

What exactly does the vertical line test look for?

Ans. The vertical line test is a graphical method for determining whether a plane curve represents by visually inspe...Read full

What is the name of a line test used to determine?

Ans. The vertical line test is a visual method used in mathematics to determine whether a curve is a graph of a func...Read full

What exactly is the horizontal line test, and how does it work?

Ans. The horizontal line test is a method for determining whether or not a function is one-to-one. This means that t...Read full

How does one determine the function of a graph?

Ans. The vertical line test can be used to determine whether a graph represents a function. If a vertical line is mo...Read full

Ans. For graphing functions, we must construct a table of values and plot its asymptotes, xand y-intercepts, holes, and a few points on it. Then simply join the point while avoiding asymptotes and noting the function’s domain and range.

Ans. The vertical line test is a graphical method for determining whether a plane curve represents by visually inspecting the number of intersections of the curve with vertical lines, you can create a graph of a function. As a result, any vertical line in the plane can only intersect a function’s graph once.

Ans. The vertical line test is a visual method used in mathematics to determine whether a curve is a graph of a function. For each unique input, x, a function can only have one output y.

Ans. The horizontal line test is a method for determining whether or not a function is one-to-one. This means that there is only one unique x-value for each y-value in the function.

Ans. The vertical line test can be used to determine whether a graph represents a function. If a vertical line is moved across the graph and only touches the graph at one point at any time, the graph is a function. If the vertical line intersects the graph more than once, the graph is not a function.

Crack IIT JEE with Unacademy

Get subscription and access unlimited live and recorded courses from India’s best educators

  • Structured syllabus
  • Daily live classes
  • Ask doubts
  • Tests & practice
Learn more

Notifications

Get all the important information related to the JEE Exam including the process of application, important calendar dates, eligibility criteria, exam centers etc.

Allotment of Examination Centre
JEE Advanced Eligibility Criteria
JEE Advanced Exam Dates
JEE Advanced Exam Pattern 2023
JEE Advanced Syllabus
JEE Application Fee
JEE Application Process
JEE Eligibility Criteria 2023
JEE Exam Language and Centres
JEE Exam Pattern – Check JEE Paper Pattern 2024
JEE Examination Scheme
JEE Main 2024 Admit Card (OUT) – Steps to Download Session 1 Hall Ticket
JEE Main Application Form
JEE Main Eligibility Criteria 2024
JEE Main Exam Dates
JEE Main Exam Pattern
JEE Main Highlights
JEE Main Paper Analysis
JEE Main Question Paper with Solutions and Answer Keys
JEE Main Result 2022 (Out)
JEE Main Revised Dates
JEE Marking Scheme
JEE Preparation Books 2024 – JEE Best Books (Mains and Advanced)
Online Applications for JEE (Main)-2022 Session 2
Reserved Seats
See all

Related articles

Learn more topics related to Mathematics
Zero Vector

A zero vector is defined as a line segment coincident with its beginning and ending points. Primary Keyword: Zero Vector

ZERO MATRIX

In this article, we will discuss about the zero matrix and it’s properties.

YARDS TO FEET

In this article we will discuss the conversion of yards into feet and feets to yard.

XVI Roman Numeral

In this article we are going to discuss XVI Roman Numerals and its origin.

See all
Access more than

10,505+ courses for IIT JEE

Get subscription

Trending Topics

  • JEE Main 2024
  • JEE Main Rank Predictor 2024
  • JEE Main Mock Test 2024
  • JEE Main 2024 Admit Card
  • JEE Advanced Syllabus
  • JEE Preparation Books
  • JEE Notes
  • JEE Advanced Toppers
  • JEE Advanced 2022 Question Paper
  • JEE Advanced 2022 Answer Key
  • JEE Main Question Paper
  • JEE Main Answer key 2022
  • JEE Main Paper Analysis 2022
  • JEE Main Result
  • JEE Exam Pattern
  • JEE Main Eligibility
  • JEE College predictor
combat_iitjee

Related links

  • JEE Study Materials
  • CNG Full Form
  • Dimensional Formula of Pressure
  • Reimer Tiemann Reaction
  • Vector Triple Product
  • Swarts Reaction
  • Focal length of Convex Lens
  • Root mean square velocities
  • Fehling’s solution
testseries_iitjee
Predict your JEE Rank
.
Company Logo

Unacademy is India’s largest online learning platform. Download our apps to start learning


Starting your preparation?

Call us and we will answer all your questions about learning on Unacademy

Call +91 8585858585

Company
About usShikshodayaCareers
we're hiring
BlogsPrivacy PolicyTerms and Conditions
Help & support
User GuidelinesSite MapRefund PolicyTakedown PolicyGrievance Redressal
Products
Learner appLearner appEducator appEducator appParent appParent app
Popular goals
IIT JEEUPSCSSCCSIR UGC NETNEET UG
Trending exams
GATECATCANTA UGC NETBank Exams
Study material
UPSC Study MaterialNEET UG Study MaterialCA Foundation Study MaterialJEE Study MaterialSSC Study Material

© 2026 Sorting Hat Technologies Pvt Ltd

Unacademy
  • Goals
    • AFCAT
    • AP EAMCET
    • Bank Exam
    • BPSC
    • CA Foundation
    • CAPF
    • CAT
    • CBSE Class 11
    • CBSE Class 12
    • CDS
    • CLAT
    • CSIR UGC
    • GATE
    • IIT JAM
    • JEE
    • Karnataka CET
    • Karnataka PSC
    • Kerala PSC
    • MHT CET
    • MPPSC
    • NDA
    • NEET PG
    • NEET UG
    • NTA UGC
    • Railway Exam
    • SSC
    • TS EAMCET
    • UPSC
    • WBPSC
    • CFA

Share via

COPY