The Cumulative Distribution Function (CDF) of a random variable with real-valued X, assessed at x, is the probability function that X will assume a value less than or equal to x. It is used to describe in a table the probability distribution of random variables. And with this data, we can simply generate a CDF graphic in an Excel spreadsheet.
In other terms, CDF calculates the cumulative probability for a certain value. It is used to determine the probability of a random variable and to compare the probabilities of different values under certain conditions. For discrete distribution functions, the CDF returns the probability values up to the provided value, but for continuous distribution functions, it returns the area under the probability density function up to the supplied value.
Probability Distribution Function
The cumulative distribution function is another name for the probability distribution function (CDF). If a random variable, X, is evaluated at a location, x, then the probability distribution function provides the likelihood that X will have a value less than or equal to x. It is expressed as F(x) = P (X < x). Moreover, if the interval (a, b) is a semi-closed interval, the probability distribution function is provided by the formula P(a < X ≤ b) = F(b) – F(a). A random variable’s probability distribution function is always between 0 and 1. It is a function that is not decreasing.
The formula for the cumulative Distribution Function
The CDF for a discrete random variable is as follows:
Fx(x) = P(X ≤ x)
Where X represents the chance that a value less than or equal to x falls inside the semi-closed interval (a,b], where a < b.
Consequently, the probability inside the interval is expressed as
P(a < X ≤ b) = Fx(b) – Fx (a)
The CDF for a continuous random variable is defined as follows:
Here, X is denoted by the integration of its probability density function fx.
If the discrete component of the random variable X’s distribution has the value b, then
P(X = b) = Fx(b) – limx→b- Fx(x)
Properties of the Cumulative Distribution Function
Important characteristics of the cumulative distribution function Fx(x) of a random variable are as follows:
- Every CDF Fx is constant and non-decreasing.
limx→-∞Fx(x) = 0 and limx→+∞Fx(x) = 1
- For any real integers a and b given a random variable X that is continuous, the function fx equals the derivative of Fx, such that
FX(b) – FX(a) = P(a<X≤b) = abfxxdx
- If X is a totally discrete random variable, then it takes the values x1, x2, x3,… with probability pi = p(xi), and its cumulative distribution function (CDF) will be discontinuous at the points xi:
FX(x) = P(X ≤ x) = xi≤xPX=xi= xi≤xp(xi)
Cumulative Frequency Distribution
The frequency distribution is the set of tabular or graphical data that illustrates the frequency of observations within a specific interval. In the case of cumulative frequency, the number of additional observations is determined.
Applications of Cumulative Distribution Function
Statistical analysis is the most significant use of cumulative distribution function. In statistical analysis, CDF is utilised in two different ways.
- Using cumulative frequency analysis to determine the frequency of occurrence of values for a specific phenomenon.
- To derive certain elementary statistical characteristics through the use of an empirical distribution function that employs a formal direct estimate of CDFs.
Probability Distribution Graph
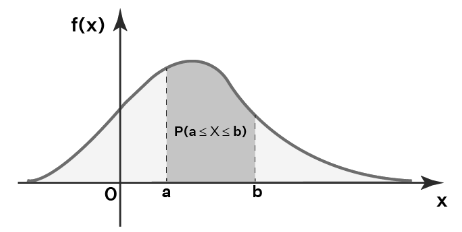
A probability distribution graph illustrates the distribution of a particular random variable. For continuous distributions, the area under a probability distribution curve must always equal one. This is analogous to discrete distributions where the total of all probabilities must equal 1.
Using the probability density function, the probability distribution graph for a continuous random variable, X, is generated. The probability distribution graph would look like this if X is between a and b.

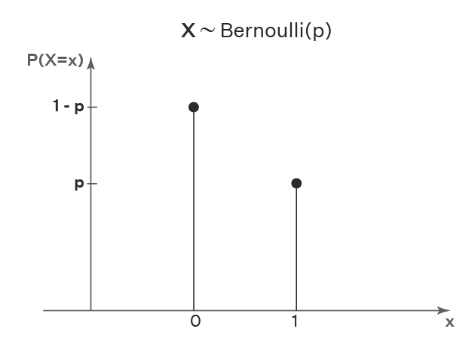
If a discrete random variable follows a probability distribution such as the Bernoulli distribution, then the probability distribution’s graph looks like this:

The outcome of a Bernoulli trial can be either 0 or 1. As seen in the graph, the random variable X may take on only the values 0 or 1.
Functions of Probability Distribution and Probability Density
Both the probability distribution function and the probability density function are used to characterise a probability distribution. A probability distribution function summarises the probability distribution of a random variable. This function is well-defined concerning both continuous and discrete probability distributions. A probability density function (pdf) applies exclusively to continuous distributions. It is the likelihood that a continuous random variable, X, will assume a value inside a certain range. Similar to the probability density function, discrete distributions employ a probability mass function (pmf). This function returns the probability that a random variable will assume an exact value. Since the likelihood that a continuous random variable would assume an exact value is zero, the pdf is used instead of the pmf for continuous distributions.
Conclusion
Allowing us to predict the chance that a particular event will occur or its variability, likelihood distributions facilitate the modelling of our environment. Probability distributions are frequently employed to characterise and perhaps anticipate the probability of an occurrence.
 Profile
 Settings
 Refer your friends
 Sign out


