Access free live classes and tests on the app
Download
+
Unacademy
  • Goals
    • AFCAT
    • AP EAMCET
    • Bank Exam
    • BPSC
    • CA Foundation
    • CAPF
    • CAT
    • CBSE Class 11
    • CBSE Class 12
    • CDS
    • CLAT
    • CSIR UGC
    • GATE
    • IIT JAM
    • JEE
    • Karnataka CET
    • Karnataka PSC
    • Kerala PSC
    • MHT CET
    • MPPSC
    • NDA
    • NEET PG
    • NEET UG
    • NTA UGC
    • Railway Exam
    • SSC
    • TS EAMCET
    • UPSC
    • WBPSC
    • CFA
Login Join for Free
avtar
  • ProfileProfile
  • Settings Settings
  • Refer your friendsRefer your friends
  • Sign outSign out
  • Terms & conditions
  • •
  • Privacy policy
  • About
  • •
  • Careers
  • •
  • Blog

© 2023 Sorting Hat Technologies Pvt Ltd

Watch Free Classes
    • Free courses
    • JEE Main 2024
    • JEE Main 2024 Live Paper Discussion
    • JEE Main Rank Predictor 2024
    • JEE Main College Predictor 2024
    • Stream Predictor
    • JEE Main 2024 Free Mock Test
    • Study Materials
    • Notifications
    • JEE Advanced Syllabus
    • JEE Books
    • JEE Main Question Paper
    • JEE Coaching
    • Downloads
    • JEE Notes & Lectures
    • JEE Daily Videos
    • Difference Between
    • Full Forms
    • Important Formulas
    • Exam Tips
JEE Main 2026 Preparation: Question Papers, Solutions, Mock Tests & Strategy Unacademy » JEE Study Material » Mathematics » Central tendency

Central tendency

in this article, we are going to learn about central tendency i.e. mean, median or mode of data.

Table of Content
  •  

Introduction 

In statistics, the central tendency measure is defined as the number that is used to represent the center or middle of a collection of data values. The mean, the median, and the mode are the three most widely used metrics of central tendency. The measure of dispersion is a statistic that shows us how the values of the data are distributed or spread out across the data set.

Central tendency 

A measure of central tendency is a single number that attempts to characterise a set of data by finding the central location in that set of data (or central tendency index). As a result, central tendency assessments are also referred to as measures of central location. Statistical summaries are also known as descriptive summaries. In addition, the median and the mode are two more measures of central tendency that should be taken into account. Consider the mean (often referred to as the average), which is the most popular central tendency measure. All three central tendency measures (mean, median and mode) can be used to determine central tendency; however, some measures of central tendency are better than others in certain situations.

Measures of Central Tendency are as follows:

In general, the central tendency of a dataset can be defined by the measurements listed below:

The mean (or average) of a dataset is represented as the sum of all values in the dataset divided by the total number of values in the dataset.

The median value in a dataset that is arranged in ascending order is the midway value in the dataset (from the smallest value to the largest value). Whenever a dataset contains an even number of variables, the median of the dataset is the mean of the two middle values, as shown in the table below.

Mode: This term refers to the value that appears the most frequently in a dataset. The presence of several modes in a dataset is possible in some instances, while the absence of any mode is possible in others.

Mean

The mean (sometimes referred to as the average) is the most often used and well-known statistician’s measure of central tendency. Although the technique is applicable to both discrete and continuous data, it is most typically used with continuous data (see our Types of Variable guide for data types). It is defined as the sum of all values in a data collection divided by the data set’s total number of values (in this case, the mean).Formula to calculate mean – 

Median 

In a sorted list of numbers, the median is the number in the middle. If you want to find out what the median value is in a sequence of numbers, you first need to sort or arrange the numbers in value order from lowest to highest or highest to lowest. When determining an estimated average or mean, the median can be utilized, but it should not be confused with the real average or mean. It is the number that is in the middle of a group of numbers with the same number of numbers below and above it that is considered the median value when there is an odd number of numbers.

To obtain the median value for a list of numbers with an even number of numbers, the middle pair must be determined, added together, then divided by two to arrive at the median value.
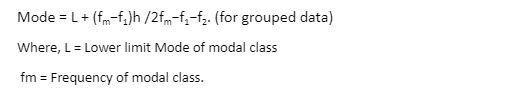
Mode 

In statistics, data can be dispersed in a variety of ways depending on the situation. The traditional normal (bell-curve) distribution is the most frequently referenced of all the distributions. According to this and certain other distributions, the mean (average) value is located at the midpoint, which is also the place at which the highest frequency of observed values is observed.  The mean, median, and mode of a normal distribution all have the same value in this case. In other words, this number is the average value, the middle value, and also the mode, which is the value that appears the most frequently in the data.

Conclusion 

In statistics, the central tendency measure is defined as the number used to represent the centre or middle of a collection of data values. Measures of central tendency are also referred to as measures of the central location in some cases. The mean, the median and the mode are all acceptable measures of central tendency. As a result, measurements of central tendency are also referred to as measures of the central location in some cases.

faq

Frequently asked questions

Get answers to the most common queries related to the IIT JEE Examination Preparation.

What is the mode in the context of an example?

Ans :The most frequent number—that is, the number that happens the most number of times—is refe...Read full

What is grouped data?

Ans : Grouped data are data that have been produced by grouping individual observations of a variab...Read full

What is ungrouped data?

Ans :Ungrouped data refers to the information you collect at the initial stages of an experiment or...Read full

What is the best method for determining central tendency?

Ans: Sort your collection of numbers in ascending order from smallest to greatest. Decide which mea...Read full

In what ways does core tendency manifest itself in practice?

Ans: Numbers that tend to cluster around the “centre” of a collection of values are referred to as measu...Read full

Ans :The most frequent number—that is, the number that happens the most number of times—is referred to as the mode. Consider the following example: The mode of the numbers {6,2,4,4,8,4,9) is 4 since it appears three times, which is more than any other number.

Ans : Grouped data are data that have been produced by grouping individual observations of a variable together in such a way that a frequency distribution of these groups can be used to summarise or analyse the data easily.

Ans :Ungrouped data refers to the information you collect at the initial stages of an experiment or study. In other words, the data is not sorted into categories, classed, or otherwise grouped; rather, it is presented as-is. In its most basic form, an ungrouped set of data is a list of numbers.

Ans: Sort your collection of numbers in ascending order from smallest to greatest. Decide which measure of central tendency you want to compute and write it down. The three categories are represented by the terms mean, median, and mode. To find the mean, add all of your data together and divide the result by the number of data points.

Ans: Numbers that tend to cluster around the “centre” of a collection of values are referred to as measures of central tendency. The mean, the median, and the mode are examples of middle numbers.


Crack IIT JEE with Unacademy

Get subscription and access unlimited live and recorded courses from India’s best educators

  • Structured syllabus
  • Daily live classes
  • Ask doubts
  • Tests & practice
Learn more

Notifications

Get all the important information related to the JEE Exam including the process of application, important calendar dates, eligibility criteria, exam centers etc.

Allotment of Examination Centre
JEE Advanced Eligibility Criteria
JEE Advanced Exam Dates
JEE Advanced Exam Pattern 2023
JEE Advanced Syllabus
JEE Application Fee
JEE Application Process
JEE Eligibility Criteria 2023
JEE Exam Language and Centres
JEE Exam Pattern – Check JEE Paper Pattern 2024
JEE Examination Scheme
JEE Main 2024 Admit Card (OUT) – Steps to Download Session 1 Hall Ticket
JEE Main Application Form
JEE Main Eligibility Criteria 2024
JEE Main Exam Dates
JEE Main Exam Pattern
JEE Main Highlights
JEE Main Paper Analysis
JEE Main Question Paper with Solutions and Answer Keys
JEE Main Result 2022 (Out)
JEE Main Revised Dates
JEE Marking Scheme
JEE Preparation Books 2024 – JEE Best Books (Mains and Advanced)
Online Applications for JEE (Main)-2022 Session 2
Reserved Seats
See all

Related articles

Learn more topics related to Mathematics
Access more than

10,505+ courses for IIT JEE

Get subscription
Challenge Yourself Everyday
Attempt 2023’s and previous year’s JEE Main
Download Important Formulas pdf
Attempt Free Test Series for JEE Main 2023

Trending Topics

  • JEE Main 2024
  • JEE Main Rank Predictor 2024
  • JEE Main Mock Test 2024
  • JEE Main 2024 Admit Card
  • JEE Advanced Syllabus
  • JEE Preparation Books
  • JEE Notes
  • JEE Advanced Toppers
  • JEE Advanced 2022 Question Paper
  • JEE Advanced 2022 Answer Key
  • JEE Main Question Paper
  • JEE Main Answer key 2022
  • JEE Main Paper Analysis 2022
  • JEE Main Result
  • JEE Exam Pattern
  • JEE Main Eligibility
  • JEE College predictor

JEE Coaching Centres

  • JEE Coaching in Nagpur
  • JEE Coaching in Ranchi
  • JEE Coaching in Gorakhpur
  • JEE Coaching in Bhubaneswar
  • JEE Coaching in Vijayawada
  • JEE Coaching in Dehradun
  • JEE Coaching in Indore
  • JEE Coaching in Gurugram
  • JEE Coaching in Muzaffarpur
  • JEE Coaching in Varanasi
  • JEE Coaching in Jammu
  • JEE Coaching in Kolhapur
  • JEE Coaching in Bikaner
  • JEE Coaching in Delhi Lajpat Nagar
Predict your JEE Rank
.
Company Logo

Unacademy is India’s largest online learning platform. Download our apps to start learning


Starting your preparation?

Call us and we will answer all your questions about learning on Unacademy

Call +91 8585858585

Company
About usShikshodayaCareers
we're hiring
BlogsPrivacy PolicyTerms and Conditions
Help & support
User GuidelinesSite MapRefund PolicyTakedown PolicyGrievance Redressal
Products
Learner appLearner appEducator appEducator appParent appParent app
Popular goals
IIT JEEUPSCSSCCSIR UGC NETNEET UG
Trending exams
GATECATCANTA UGC NETBank Exams
Study material
UPSC Study MaterialNEET UG Study MaterialCA Foundation Study MaterialJEE Study MaterialSSC Study Material

© 2026 Sorting Hat Technologies Pvt Ltd

Unacademy
  • Goals
    • AFCAT
    • AP EAMCET
    • Bank Exam
    • BPSC
    • CA Foundation
    • CAPF
    • CAT
    • CBSE Class 11
    • CBSE Class 12
    • CDS
    • CLAT
    • CSIR UGC
    • GATE
    • IIT JAM
    • JEE
    • Karnataka CET
    • Karnataka PSC
    • Kerala PSC
    • MHT CET
    • MPPSC
    • NDA
    • NEET PG
    • NEET UG
    • NTA UGC
    • Railway Exam
    • SSC
    • TS EAMCET
    • UPSC
    • WBPSC
    • CFA

Share via

COPY