Access free live classes and tests on the app
Download
+
Unacademy
  • Goals
    • AFCAT
    • AP EAMCET
    • Bank Exam
    • BPSC
    • CA Foundation
    • CAPF
    • CAT
    • CBSE Class 11
    • CBSE Class 12
    • CDS
    • CLAT
    • CSIR UGC
    • GATE
    • IIT JAM
    • JEE
    • Karnataka CET
    • Karnataka PSC
    • Kerala PSC
    • MHT CET
    • MPPSC
    • NDA
    • NEET PG
    • NEET UG
    • NTA UGC
    • Railway Exam
    • SSC
    • TS EAMCET
    • UPSC
    • WBPSC
    • CFA
Login Join for Free
avtar
  • ProfileProfile
  • Settings Settings
  • Refer your friendsRefer your friends
  • Sign outSign out
  • Terms & conditions
  • •
  • Privacy policy
  • About
  • •
  • Careers
  • •
  • Blog

© 2023 Sorting Hat Technologies Pvt Ltd

JEE Main 2026 Preparation: Question Papers, Solutions, Mock Tests & Strategy Unacademy » JEE Study Material » Mathematics » An Overview on the Probability Tree

An Overview on the Probability Tree

In the following article we are going to know about the Probability tree.

Table of Content
  •  

 A probability tree diagram is a visual depiction of the probabilities and outcomes of an event. There are two pieces to a probability tree diagram: nodes and branches. An event is represented by a node. The term “branch” refers to the link between an occurrence and its result. A probability tree diagram can be used to represent both conditional and independent probabilities.

Definition of Probability Tree

The chance of events occurring is represented using a probability tree diagram rather than elaborate calculations. It shows all of the probable outcomes of a situation. A probability tree’s objective is to display all of the possible outcomes of an event and compute the likelihood of each one. A probability tree diagram can be used to illustrate conditional probabilities or to show a succession of independent occurrences.

Component of the Probability Tree Diagram

A probability tree has two primary components. The nodes and branches are these. The nodes can be further divided into parent and sibling nodes. The parent node denotes a specific occurrence with a probability of one. Other alternative occurrences or consequences are represented by the sibling nodes. The branches represent the likelihood of these occurrences occurring. If a fair coin is tossed once, the following probability tree may be constructed: 

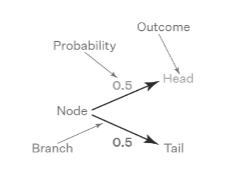
This is a straightforward probability tree with only two branches. The parent event of a coin toss is represented by the first node. The two potential outcomes that make up the sibling nodes are head and tail. The likelihood of each sibling event occurring is represented by the number 0.5 on the branch.

Example of a Probability Tree Diagram:

Assume you need to create a probability tree diagram for flipping a fair coin twice. Because the outcome of each coin toss is independent of the preceding flip, this is an example of an independent event. To begin, construct the probability tree diagram of a coin-flipping once as shown in the previous section. The next stage is to increase the number of coin tosses to two:

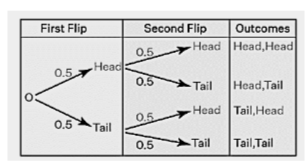
The second coin flip is represented by the second set of probability. As a result, there are four possible outcomes.

Multiply the probabilities along the branches of the probability tree diagram to compute the possibilities of a series of occurrences. The overall likelihood may be calculated by putting these probabilities together, and the result will always be 1.

The probability tree diagram may be used to make the following inferences:

  • The chances of receiving the result (Head, Head) are 0.5 x 0.5 = 0.25. The likelihood of the other eventualities may be computed in the same way.
  • 0.25 + 0.25 + 0.25 + 0.25 Equals 1. This means that when the odds of each scenario are added together, the total equals 1.
  • The chance of receiving exactly one head may be estimated using the probability tree as 0.25 + 0.25 = 0.5.

Diagram of a Conditional Probability Tree:

The result of dependent events can be shown using a conditional probability tree diagram. A dependent event is one in which the result is influenced by a prior occurrence. Assume a student is required to take two tests. The chances of his passing the first test are 0.7. If he passes the first test, he has a 0.8 chance of passing the second. Furthermore, if he fails the first test, he has a 0.6 chance of passing the second. The probability tree diagram may be made using the procedures below to obtain the conditional likelihood that he will fail both tests.

Step 1: For the first test, create a probability tree diagram. Because the chance of passing the first test is 0.7, the chance of failing is 1 – 0.7 = 0.3.

Step 2: If the student passes the first test, construct branches for the second test. It’s worth noting that the total of result probabilities, 0.8 + 0.2, equals 1.

Step 3: Now, if the student fails the first test, design branches for the second test.

Step 4: To acquire the conditional probability results, multiply the probabilities along each branch of the probability tree.

Building Probability Tree:

To build a probability tree diagram, you must first determine all conceivable outcomes and their corresponding probabilities. The following are the stages of making a probability tree:

  • Step 1: Determine if the occurrences are dependent or independent in the first step.
  • Step 2: To illustrate the first set of outcomes, draw branches.
  • Step 3: On the branch, write the probabilities associated with each result.
  • Step 4: Determine if the upcoming occurrences are dependent or independent and draw the next set of branches. Include the corresponding probability as well.
  • Step 5: Repeat step 5 as many times as necessary.
  • Step 6: The probabilities along the branches must be compounded to obtain the overall probability of the probability tree. The total of these probabilities should never be less than one.

Conclusion:

In probability theory, a tree diagram can be used to depict a probability space. Tree diagrams can be used to illustrate a succession of independent events (such as a series of coin flips) or conditional probabilities (such as drawing cards from a deck, without replacing the cards). Each node in the diagram represents an event and is connected with a probability. The root node has probability 1 since it represents a certain occurrence. Each sibling node represents a full and distinct split of the parent event.

faq

Frequently asked questions

Get answers to the most common queries related to the JEE Examination Preparation.

In probability theory, what is a probability tree diagram?

A probability tree diagram is a visual depiction of the likelihood of all conceivable outcomes of an event occurring...Read full

What does a probability tree diagram look like?

 A probability tree diagram is made up of two sections. The following are the details: ...Read full

What is a conditional probability tree diagram, and how does it work?

Conditional probabilities are represented using a conditional probability tree diagram. To put it another way, this ...Read full

What is a probability tree?

The following are the stages to drawing a probability tree: ...Read full

How to use a probability tree diagram to calculate the probability of multiple events

The first step is to multiply the probability values of connected branches in the probability tree diagram to obtain...Read full

A probability tree diagram is a visual depiction of the likelihood of all conceivable outcomes of an event occurring. It may be used to show how events are dependent and independent.

 A probability tree diagram is made up of two sections. The following are the details:

Node: It is used to represent an event as a node.

Branch: A branch is used to link two occurrences together. A branch represents the chance of an event occurring.

Conditional probabilities are represented using a conditional probability tree diagram. To put it another way, this probability tree may be used to calculate the probabilities of dependent event outcomes.

The following are the stages to drawing a probability tree:

  • Draw the first set of outcomes into branches and write the individual probabilities along the branches.
  • Repeat the procedure for the remaining results.
  • To calculate the chance of each result, multiply the probabilities of the connected branches.

The first step is to multiply the probability values of connected branches in the probability tree diagram to obtain the likelihood of each scenario. To estimate the probability of numerous occurrences, sum the probabilities associated with the needed events.

Crack IIT JEE with Unacademy

Get subscription and access unlimited live and recorded courses from India’s best educators

  • Structured syllabus
  • Daily live classes
  • Ask doubts
  • Tests & practice
Learn more

Notifications

Get all the important information related to the JEE Exam including the process of application, important calendar dates, eligibility criteria, exam centers etc.

Allotment of Examination Centre
JEE Advanced Eligibility Criteria
JEE Advanced Exam Dates
JEE Advanced Exam Pattern 2023
JEE Advanced Syllabus
JEE Application Fee
JEE Application Process
JEE Eligibility Criteria 2023
JEE Exam Language and Centres
JEE Exam Pattern – Check JEE Paper Pattern 2024
JEE Examination Scheme
JEE Main 2024 Admit Card (OUT) – Steps to Download Session 1 Hall Ticket
JEE Main Application Form
JEE Main Eligibility Criteria 2024
JEE Main Exam Dates
JEE Main Exam Pattern
JEE Main Highlights
JEE Main Paper Analysis
JEE Main Question Paper with Solutions and Answer Keys
JEE Main Result 2022 (Out)
JEE Main Revised Dates
JEE Marking Scheme
JEE Preparation Books 2024 – JEE Best Books (Mains and Advanced)
Online Applications for JEE (Main)-2022 Session 2
Reserved Seats
See all

Related articles

Learn more topics related to Mathematics
Zero Vector

A zero vector is defined as a line segment coincident with its beginning and ending points. Primary Keyword: Zero Vector

ZERO MATRIX

In this article, we will discuss about the zero matrix and it’s properties.

YARDS TO FEET

In this article we will discuss the conversion of yards into feet and feets to yard.

XVI Roman Numeral

In this article we are going to discuss XVI Roman Numerals and its origin.

See all
Access more than

10,505+ courses for IIT JEE

Get subscription
Company Logo

Unacademy is India’s largest online learning platform. Download our apps to start learning


Starting your preparation?

Call us and we will answer all your questions about learning on Unacademy

Call +91 8585858585

Company
About usShikshodayaCareers
we're hiring
BlogsPrivacy PolicyTerms and Conditions
Help & support
User GuidelinesSite MapRefund PolicyTakedown PolicyGrievance Redressal
Products
Learner appLearner appEducator appEducator appParent appParent app
Popular goals
IIT JEEUPSCSSCCSIR UGC NETNEET UG
Trending exams
GATECATCANTA UGC NETBank Exams
Study material
UPSC Study MaterialNEET UG Study MaterialCA Foundation Study MaterialJEE Study MaterialSSC Study Material

© 2026 Sorting Hat Technologies Pvt Ltd

Unacademy
  • Goals
    • AFCAT
    • AP EAMCET
    • Bank Exam
    • BPSC
    • CA Foundation
    • CAPF
    • CAT
    • CBSE Class 11
    • CBSE Class 12
    • CDS
    • CLAT
    • CSIR UGC
    • GATE
    • IIT JAM
    • JEE
    • Karnataka CET
    • Karnataka PSC
    • Kerala PSC
    • MHT CET
    • MPPSC
    • NDA
    • NEET PG
    • NEET UG
    • NTA UGC
    • Railway Exam
    • SSC
    • TS EAMCET
    • UPSC
    • WBPSC
    • CFA

Share via

COPY