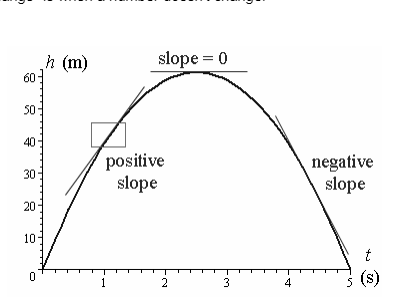
Usually, the change in an amount over time is used to define the rate of change. For example, the derivative of speed shows how fast speed changes over time. This is shown by ds/dt. The rate of change of distance in relation to time is another example.
In a similar vein, in the event that one quantity, say y, alters its relationship to another quantity, x, in such a way that y = f(x), The following equation will give you the rate of change of y with regard to x : dy/dx ie f’(x).
So, for the function y = f(x), d/dx (f(x)) shows how quickly y is changing in relation to x.
If a quantity ‘y’ changes with a change in some other quantity ‘x’ given the fact that an equation of the form y = f(x) is always satisfied i.e. ‘y’ is a function of ‘x’; then the rate of change of ‘y’ with respect to ‘x’ is given by
Δy/Δx=(y2–y1)/(x2–x1)
If the rate of change of a quantity (dy/dx) goes up, it is shown by a positive sign.
If the rate of change, dy/dx, of a quantity goes down, it is shown by a negative sign.
If two variables, say x and y, change based on a third variable, t, that is, if x = f(t) and y = f(t), then the Chain Rule says:
dy/dx = (dy/dt)/(dx/dt)
Where, dx/dt≠0
So, we can find the rate of change of variable y with respect to x by finding the rate of change of both y and x with respect to t.
It has to do with whether the y variable goes up or down in relation to another variable. And a “zero rate of change” is when a number doesn’t change.
Positive Rate of Change: If the value of y goes up as x goes up, then dy/dx is positive. This means that the function’s graph goes up.
Negative Rate of Change: If the value of y goes down as x goes up, then dy/dx will be negative. This means that the function’s graph will move down.
Zero Rate of Change: If the value of y stays the same as x goes up or down, then dy/dx will be 0. This means that the function’s graph will stay the same.
Formula 1: For the rate of change, the basic formula is:
Rate of change = (Change in quantity 1)/(Change in quantity 2)
Formula 2: Algebraic formulas for rates of change
Δy/ Δx = (y2−y1)/(x2−x1)
Rate of change of functions: (f(b)-f(a))/(b-a)
How something changes over time is shown by its rate of change.
Ex 1. Use the rate of change formula to figure out the rate of change for the table below:
Time Spent Driving (in hr) | Distance Travelled (in miles) |
2 | 40 |
4 | 180 |
Solution:
Look for Change rate
By using the formula for the rate of change,
Rate of change = (Change in quantity 1)/(Change in quantity 2)
Rate of change = (Distance moved) / (Change in time)
Change rate = (180-40) / (4-2)
Change rate = (140) / (2)
Change rate = 70
Ex 2. The formula for a city’s population is P(t) = 2t2 + 10t + 200 people (t is the number of years since 2000). What is the average rate of change in the population in 2005?
Solution: For the average rate, we need information about where our domain starts and where it ends. It’s clear that the starting point would be the year 2000, since t1 = 0 and P(t = 0) = 200 at that time. The endpoint is: t2 = (2005-2000) = 5, which means P(t = 5) = 300. In 2005, the average rate of change in population was:
ΔP/Δt=(P2–P1)/(t2–t1)
= (300 – 200) / (5 – 0) = 20 people per year
One of the most important ways to use derivatives is to figure out how fast something changes in relation to something else. You use these ideas all the time without even realizing it. For example, your mother knows just how much sugar to put in the tea to make it the right amount sweet.



 Profile
 Settings
 Refer your friends
 Sign out