Introduction to hydrogen spectrum
A hydrogen atom consists of two protons and two electrons held together by electrostatic forces. This force leads to a set of quantum states, each with its own energy. These states were envisioned by the Bohr model of the hydrogen atom as being different orbits around the nucleus.Each energy level, electron shell, or orbit is symbolised by an integer, n. However, quantum mechanics later superseded the Bohr model. As a result, the electron occupies an atomic orbital instead of an orbit. However, the allowed energy levels of the hydrogen atom stayed the same as in the earlier theory.
Spectral emission ensues when an electron evolves or jumps from a higher energy state to a lower one. To differentiate between the two states, the lower energy state is generally symbolised as n2, and the higher energy state is symbolised as n1. The energy of an emitted photon corresponds to the energy difference between the two states. Because each state’s energy is fixed, the energy difference is fixed, and evolution will always produce a photon with the same energy.
Rydberg formula
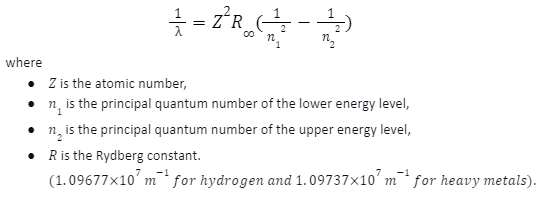
The emission spectrum of atomic hydrogen has been split into several spectral series, with wavelengths given by the Rydberg formula. The energy differences between levels in the Bohr model, and therefore the wavelengths of emitted or absorbed photons, is given by the Rydberg formula:

Emission spectrum of hydrogen
The spectral lines are grouped into series according to n′. Lines are named sequentially, starting from the most comprehensive wavelength or lowest frequency of the series, using Greek letters within each series.
Lyman series
In the Bohr model, the Lyman series comprises the lines emitted by electron transitions from an exterior orbit of quantum number n2 > 1 to the first orbit of quantum number n1=1 The transitions are named consecutively by Greek letters: n2 = 2 to n2 = 1 is called Lyman-alpha, 3-1 is called Lyman-beta,4-1 is called Lyman-gamma, etc. The series is named after its discoverer, Theodore Lyman. The more significant the difference in the principal quantum numbers, the higher the energy of the electromagnetic emission.
Balmer series
The Balmer series is indicated by the electron transitioning from n2 ≥ 3 to n1 = 2, where n2 refers to the electron’s radial quantum number or principal quantum number. The transitions are named consecutively by Greek letter: n2 = 3 – 2 is called H-α, 4 to 2 is H-β, 5 to 2 is H-γ, and 6 – 2 is H-δ. The first spectral lines in this series are found in the visible part of the electromagnetic spectrum. These lines are referred to as “H-alpha,” “H-beta,” “H-gamma,” and so on, where H is the element hydrogen
Paschen series
The Paschen series is indicated by the electron transitioning from n2 ≥ 4 to n1 = 3, where n refers to the electron’s radial quantum number or principal quantum number. It was quoted after the German physicist Friedrich Paschen discovered them in 1908. All the Paschen lines fall in the infrared band. This series coincides with the following (Brackett) series, i.e., the shortest line in the Brackett series has a wavelength that falls in the Paschen series. All subsequent series overlap.
Brackett series
The Brackett series is indicated by the electron transitioning from n2 ≥ 5 to n1 = 4, where n refers to the electron’s radial quantum number or principal quantum number. It was quoted after the American physicist Frederick Sumner Brackett discovered the spectral lines in 1922. The spectral lines of the Brackett series lie in a distant infrared band.
Pfund series
The Pfund series is indicated by the electron transitioning from n2 ≥ 6 to n1 = 5, where n refers to the electron’s radial quantum number or principal quantum number. It was quoted after it was Experimentally first observed in 1924 by August Herman Pfund.
Humpfrey’s series
The Humphrey series is indicated by the electron transitioning from n2 ≥ 7 to n1 = 6, where n refers to the electron’s radial quantum number or principal quantum number. It was quoted after it was first observed in 1953 by American physicist Curtis J. Humphreys.
Further series
Other series are still untitled but obey the same convention and equation dictated by the Rydberg equation. Series are increasingly outstretched and ensue at increasing wavelengths. The lines are also increasingly unclear due to increasingly rare atomic events. The seventh series of atomic hydrogen was first proved experimentally at infrared wavelengths in 1972 by Peter Hansen and John Strong at the University of Massachusetts Amherst.
Conclusion
The notions of the Rydberg formula can be used in any system with a single particle orbiting a nucleus, for example, a He+ ion or a muonium exotic atom. The equation must be adjusted based on the system’s Bohr radius; emissions will be comparable but at a different range of energies. For example, the Pickering–Fowler series was initially attributed to an unknown form of hydrogen with half-integer transition levels by both Pickering and Fowler. However, Bohr correctly determined them as spectral lines from the He+ nucleus.All other atoms have at least two electrons in their neutral form. The dealings between these electrons make the spectrum analysis by such simple methods as described here impractical. The deduction of the Rydberg formula was a substantial measure in physics. However, it was long before an extension to the spectra of other elements could be achieved.
 Profile
 Settings
 Refer your friends
 Sign out


