According to Heisenberg’s uncertainty principle, we can never know the exact position of an electron travelling around the nucleus at a specific velocity. As a result, we speak in terms of the likelihood of its occurrence in any given region. In other words, we use a probability function to determine its location.
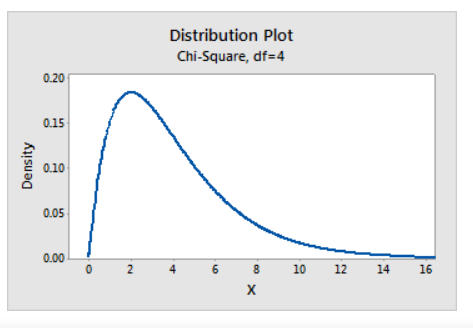
Plotting a single probability distribution
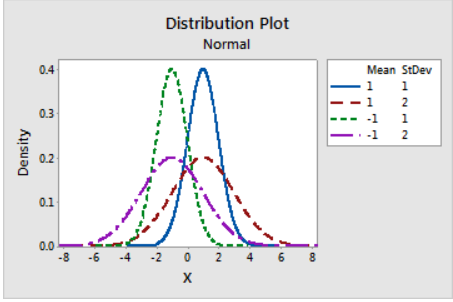
Plotting a probability distribution with different parameters
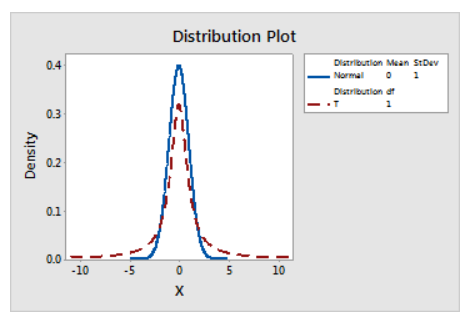
Two-distribution probability distribution plot
You can compute the likelihood of an occurrence using the probability density function (PDF) of a random variable, X, as follows:
The likelihood that X has values in the interval (a,b) for continuous distributions is equal to the area under its PDF in the interval (a,b).
The probability that X has values in the interval (a,b) for discrete distributions is equal to the sum of the PDF (also known as the probability mass function) of the potential discrete values of X in the interval (a,b) (a,b).
Determine the probability density function’s value at a known value x of the random variable X using PDF.
Probability distribution formula
Any statistical function that specifies all possible outcomes of a random variable within a certain range of values is referred to as a “probability distribution.” The normal distribution is one of the most frequent probability distributions. The chi-square distribution, Binomial distribution, and Poisson distribution are three more prominent types of probability distributions.
On the other hand, the term “probability distribution formula” refers to the formula for a probability distribution’s mean, standard deviation, skewness, and kurtosis. The formula for mean and standard deviation, on the other hand, will be discussed in this article.
In a probability distribution, the mean is the expected value of the random variable. The aggregate of the products of the random variable’s value and its probability is the formula for the mean of a probability distribution. It is expressed mathematically as,
X = [ Xi * P(Xi)]
where,
xi = The random variable’s value in the ith observation
P(xi) denotes the likelihood of the ith value
The standard deviation is a measure of how far each random variable’s value deviates from its expected value. The square root of the aggregate of the product of the square of each value’s deviation from the mean and the probability of each value is the formula for standard deviation. It is expressed mathematically as,
= (Xi – X)2 * P(Xi)
The position of the region in space where we wish to find the probability of the existence of the electron will change the probability function. The likelihood that the electron will be discovered in the small cubic volume element of dimension dxdydz is provided by the product of 𑄺(x, y, z) and the volume of the small cubic volume element. i.e. by 𑄺(x,y,z) dxdydz. A cube with dimensions de dy, de, centred on the point 𑄺(x, y, z) represents the tiny volume element. Around the point sy, the small volume element ddyde is alternatively written as 1.
Probability density is another name for the function . Consider dividing the entire space into a number of these volume pieces. The sum of all terms of the form 𑄺dxdydz or 𑄺d𑁮 will yield the entire probability of locating the electron in all of space. The entire probability must equal unity since the electron must be someplace in space. Thus,
– +d = – +dxdydz =1 (1)
The idea of probability explains the basic law of nature that our awareness of a small moving particle’s position can never be absolute.
Assume that the wave equation’s solution for a single particle is a function Ψ (x, y, z), which is referred to as the wave function. As previously stated, the factory symbolises the wave’s amplitude. As far as one can tell, it has no physical relevance. It is the square of the amplitude (Le significance rather than the amplitude (e.g. Ψ) itself in the case of waves).
Consider electromagnetic radiation’s dual nature. According to wave theory, the square of the wave’s amplitude, which can be calculated by solving the applicable wave equation, is used to calculate the intensity of radiation. The photon theory relates the number of photons in a certain volume, Le photon density, to the intensity of radiation. Because photons are tiny particles, their density is proportional to the probability of their presence in a given volume, which is known as the probability density. As a result, the probability density, or the chance of detecting a photon in a given volume, is proportional to the square of the associated wave’s amplitude. By analogy, therefore, Ψ( the square of the amplitude) will be a measure of the probability of finding an electron in the given volume. Accordingly,
(x,y,z) ²(x. y. z) = k² (x, y, z) (2)
We set the proportionality constant & in such a way that equality replaces proportionality. If (x. y. z) is the Schrodinger wave equation solution for any system, then the same wave equation solution is multiplied by any constant. As a result, we can use (1k) instead of in Eq 2, resulting in:
𑄺(x,y,z) = k1k (x,y,z) = ² (x. y. z) (3)
– +d = – +²d = 1
( – +d =1 ) (4)
The factor²d represents the probability of locating the electron in the small volume element d.
Consider a hydrogen atom in its ground state, where the hydrogen nucleus and its lone electron are visible. Assume that the nucleus remains at a fixed location while the electron moves. If an electron could register its position as a dot every 1/1000th of a second for a thousand seconds, the highest concentration of such dots would be closest to the nucleus and would continue to decrease as the distance between the nucleus and the electron grows in all directions.
This demonstrates that the best chance of finding the electrons is closest to the nucleus and that the probability of finding them decreases as the distance from the nucleus grows. It should be noted that the actual position of the electron cannot be specified. All we can ever know is a specific patch of space within which the presence of the electron is possible. The electron charge cloud is made up of the electron probability distribution in three-dimensional space around the nucleus. The likelihood of locating the electron is greatest in the location where such an electron cloud is thickest, i.e., where the number of dots indicating the position of the electron is greatest.
The probability density function has also been referred to as a “probability distribution function” and a “probability function”. However, among probabilists and statisticians, this usage is not common. In other sources, “probability distribution function” may refer to the cumulative distribution function or a probability mass function (PMF) rather than the density when the probability distribution is described as a function over general sets of values. The term “density function” is also applied to the probability mass function, causing even more confusion. In general, the PMF is used with discrete random variables (random variables that take values from a countable set), whereas the PDF is used with continuous random variables. We can only visually understand the distribution of data by displaying probability density charts without knowing the exact probability for a given range of values.
 Profile
 Settings
 Refer your friends
 Sign out