Access free live classes and tests on the app
Download
+
Unacademy
  • Goals
    • AFCAT
    • AP EAMCET
    • Bank Exam
    • BPSC
    • CA Foundation
    • CAPF
    • CAT
    • CBSE Class 11
    • CBSE Class 12
    • CDS
    • CLAT
    • CSIR UGC
    • GATE
    • IIT JAM
    • JEE
    • Karnataka CET
    • Karnataka PSC
    • Kerala PSC
    • MHT CET
    • MPPSC
    • NDA
    • NEET PG
    • NEET UG
    • NTA UGC
    • Railway Exam
    • SSC
    • TS EAMCET
    • UPSC
    • WBPSC
    • CFA
Login Join for Free
avtar
  • ProfileProfile
  • Settings Settings
  • Refer your friendsRefer your friends
  • Sign outSign out
  • Terms & conditions
  • •
  • Privacy policy
  • About
  • •
  • Careers
  • •
  • Blog

© 2023 Sorting Hat Technologies Pvt Ltd

NTA UGC NET 2023 » NTA Study Materials » Pharmaceutical Analysis » Titration Curve Method
doubtsolving_ntaugc

Titration Curve Method

The titration curve represents the graphical representation of the pH of the solution. Read this article to know more about what a titration curve is.

Table of Content
  •  

Titration is a technique used to check the concentration of an unknown solution. The solution of a known concentration is added through the burette to the volume of the solution of unknown concentration until the reaction is complete. An indicator is used as a signal at the end of the reaction, known as the endpoint. The analyte and titrant both form a pair of acid and base. These types of titrations are observed through the change in pH as titration progresses. A titration curve represents the graphical view of the pH of the solution during the process of titration.

Basic Terms

Here are some important terminologies before we study titration curves:

  • Titrant: It means a known solution of a concentration added to a different solution and has to be determined.

  • Analyte: It is the solution whose concentration has to be determined.

  • Equivalence point: It is a point in the titration at which the titrants added are sufficient to neutralise the solution of the analyte.

In a strong-acid base of the titration, when both acid and base moles are equal, and the pH reaches the level of 7, the equivalence point is reached. On the other hand, in weak acid and a strong base of titration, the pH level is always greater than 7 at the equivalence point.

Relationship Between Titration Curve and Equivalence Point

Titration Curve in Case of a Strong Base and Strong Acid

At the beginning of titration, as we mix the base with the acid, the pH level rises at a slow rate. Nearest to the point of equivalence, the pH started increasing rapidly. If the titration is like a strong base acid, the pH at the equivalence point equals 7. The rate at which the pH changes will again move down.

The picture below shows a strong acid and a strong base of the titration curve:

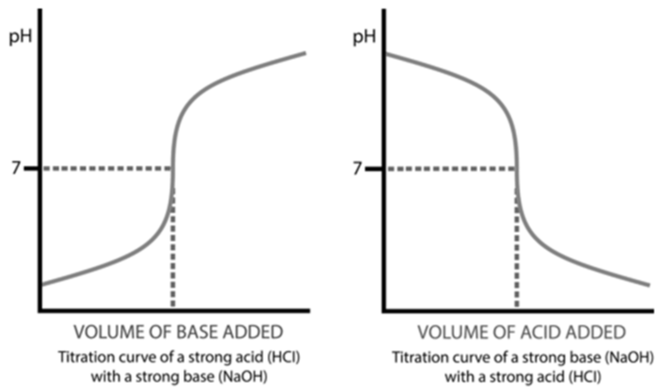
The titration curve shows the pH that occurs during the titration of an acid with the base. The left figure shows the titration when the base is added to the acid to increase the pH level. On the right side, the acid is added to the base. In both cases, the equivalence point is touched when the moles of both base and acid are at equilibrium, and the pH level is 7.

Titration Curve in Case of a Weak Acid and Strong Base

A titration curve can also be obtained when the acid is strong, and the base is weak. The shape of the general titration is the same, but the only change that occurs will be in the equivalence point.

When the acid is weak and the base is strong, the pH level is always more than 7 at the equivalence point. In the case of a strong acid and weak base, the pH is always less than 7 at the equivalence point.

Conclusion

The titration curve is calculated to determine the concentration of an unknown solution when any known chemical is mixed with the solution. It is a non-expensive, valuable tool that represents the graphical view of the pH of the solution during the process of titration. 

The above article explores the relation between titration curves and equivalence points. The titration curve of a strong acid and base is always S-shaped on the graph. The pH level changes in every situation with the change in equivalence point.

faq

Frequently asked questions

Get answers to the most common queries related to the NTA Examination Preparation.

What does the titration curve show us?

Ans. Points along the titration curve tell us about the concentration of an unknown solution and the pH level as the...Read full

Why is the shape of the titration curve S-shaped?

Ans. The S-shaped curve occurs due to the fixed increase in the solution’s volume during titration, causing the so...Read full

What is the relation between titration curves and equivalence points?

Ans. A change of a factor of 10 occurs very fast, near the equivalence point, causing the titration curve to become ...Read full

What is the importance of the titration curve?

Ans. Titration curves are necessary because they show accurate information about the amount of acid in a solution. I...Read full

How can we use the titration curves in real life?

Ans. Titration is widely used in the food industry, and titration curves can be used to analyse the amount of reacta...Read full

Ans. Points along the titration curve tell us about the concentration of an unknown solution and the pH level as the size of the known chemical rises with it.

Ans. The S-shaped curve occurs due to the fixed increase in the solution’s volume during titration, causing the solution to become diluted.

Ans. A change of a factor of 10 occurs very fast, near the equivalence point, causing the titration curve to become steep. When the absorption of hydronium ions decreases, more base is needed to change the level of pH.

Ans. Titration curves are necessary because they show accurate information about the amount of acid in a solution. It analyses the present buffer’s strength system, helping understand the compound nature of acidic mining.

Ans. Titration is widely used in the food industry, and titration curves can be used to analyse the amount of reactant in a sample. For instance, titration curves can show the level of sugar and salt or the absorption of vitamins C or E.

Crack NTA UGC with Unacademy

Get subscription and access unlimited live and recorded courses from India’s best educators


  • Structured syllabus
  • Daily live classes
  • Ask doubts
  • Tests & practice
Learn more

Notifications

Get all the important information related to the NTA UGC Examination including the process of application, important calendar dates, eligibility criteria, exam centers etc.

Application Process
NTA UGC Results
UGC NET Admit Card
UGC NET Eligibility Criteria 2023
UGC NET Exam Pattern 2023: Paper 1 & Paper 2 Marking Scheme
See all

Related articles

Learn more topics related to Pharmaceutical Analysis
Why Quality Control in Pharmacy Is Important

Quality control means evaluating product quality against set criteria. This article explains the role of quality control in the pharmaceutical industry.

What is the Use of Nitrobenzene in the Assay of Halides, Ammonium Chloride, and Thiourea By Volhard’s Method

Learn about Nitrobenzene in the assay of Halides, Ammonium Chloride, and Thiourea by Volhard's Method.

What is the Process of Transcription and Translation?

What is transcription and translation, localisation of transcription and translation, its factors, transcription and translation diagram, and its comparison.

What is the Effect of Temperature and pH on Extraction?

The isolation of major or simply the active components from the drug material is classified as the process of extraction in pharmaceutics. Many factors are responsible for this process; the most important being pH, and temperature. Let us look further into this topic.

See all
Access more than

7,940+ courses for NTA-UGC-NET and SET Exams

Get subscription
freeliveclasses_ntaugc
testseries_ntaugcnet
Subscribe Now
.
Company Logo

Unacademy is India’s largest online learning platform. Download our apps to start learning


Starting your preparation?

Call us and we will answer all your questions about learning on Unacademy

Call +91 8585858585

Company
About usShikshodayaCareers
we're hiring
BlogsPrivacy PolicyTerms and Conditions
Help & support
User GuidelinesSite MapRefund PolicyTakedown PolicyGrievance Redressal
Products
Learner appLearner appEducator appEducator appParent appParent app
Popular goals
IIT JEEUPSCSSCCSIR UGC NETNEET UG
Trending exams
GATECATCANTA UGC NETBank Exams
Study material
UPSC Study MaterialNEET UG Study MaterialCA Foundation Study MaterialJEE Study MaterialSSC Study Material

© 2025 Sorting Hat Technologies Pvt Ltd

Unacademy
  • Goals
    • AFCAT
    • AP EAMCET
    • Bank Exam
    • BPSC
    • CA Foundation
    • CAPF
    • CAT
    • CBSE Class 11
    • CBSE Class 12
    • CDS
    • CLAT
    • CSIR UGC
    • GATE
    • IIT JAM
    • JEE
    • Karnataka CET
    • Karnataka PSC
    • Kerala PSC
    • MHT CET
    • MPPSC
    • NDA
    • NEET PG
    • NEET UG
    • NTA UGC
    • Railway Exam
    • SSC
    • TS EAMCET
    • UPSC
    • WBPSC
    • CFA

Share via

COPY