Profile
 Settings
 Refer your friends
 Sign out


In 1960, Harary and Norman published a paper from which the name ‘line graph’ evolved. A line graph is the method of representation of information in a chart—this information changes over a specific time.
In the line graph, information is plotted using various points. Different straight lines connect these different points. Due to its representation in the form of multiple straight lines, it is also known as a line chart.
There are different sample questions of line graphs through which we will get the idea about the line graph plotting. Before that, let’s see the components of a line graph.
Components of Line Graphs
Let’s look at the five main components of line graphs.
- Title: You can identify the type of information given by a line graph using a title.
- Scale: A most crucial component of a line graph, the scale decides the parameters shown on both the axes.
- Labels: This component names each part of the line graph to be easily recognised.
- Points: The points are the dots plotted on the graph based on the tabular data given.
- Line: A straight line drawn by joining all the points present on the graph.
Steps for Plotting a Given Data as a Line Graph
Write the title of the graph
To know the purpose of the graph, the title should be mentioned in the upper part of the graph.
Draw Both the Axis of the Graph
After correctly giving the title to the graph, draw two perpendicular lines. In other words, draw the x-axis and y-axis, horizontally and vertically, respectively, on graph paper.
Plot the Data Elements
The element representing time as a factor should be plotted on the x-axis. On the other hand, the variable term element should be plotted on the vertical y-axis.
Plot Given Element Provided in Data
In the given data, plot each point on the graph concerning the x-axis and y-axis.
Draw a Straight Line
Join all the dots plotted on the graph paper in a straight line.
The Graph is Ready
Once you get a straight line by joining the plotted dots, your line graph is completed.
Types of Line Graph
Simple Line Chart
In this type of line graph, only a single line represents the relation between two variables. Out of the two variables, one is independent while the other is dependent on the former variable.
Multiple Line Chart
In this line graph, more than two lines show the relationship between more than two variables. Also, these multiple variables change over time. On the x-axis, the independent variable is present, and on the y-axis, the dependent variable is plotted.
Compound Line Chart
When given data is divided into different types, this line graph is used to plot the information.
Double Line Graph
In this graph, two lines represent the dynamic nature of the data depending upon the changes occurring due to changes in time. It compares the pattern as well as the trend between two different elements.
Steps to Quickly Solve the Line Graph Problems
Samples of a Line Graph
Data representation by a line graph plays a crucial role in identifying a trend or knowing about particular progress. Let’s understand this concept with examples.
Before approaching the sample, let’s look at the steps for quickly solving line graph problems.
Following are the steps for quickly solving line graph problems.
- Mention the title of the given line graph.
- Find your data range to start your y-axis less than your lowest number.
- Find out the increasing value of your x-axis and the y-axis.
- Name the horizontal line as the x-axis and the vertical line as the y-axis.
- Plot your data elements on the intersection point of the x- and y-axis.
- Write the explanation about the line passing through the intersection.
Sample
Consider the two variables that are given in the data. One denotes the days, and the other represents calories burned on a particular day by doing exercise.
Days | Calories Burned |
Day 1 | 45 Calories |
Day 2 | 36 Calories |
Day 3 | 23 Calories |
Day 4 | 38 Calories |
Day 5 | 14 Calories |
Day 6 | 36 Calories |
Answer
The line graph for the above question is:
The x-axis represents days, and the y-axis represents calories burned each day. By plotting a line graph, we can give an idea about the given data representation.
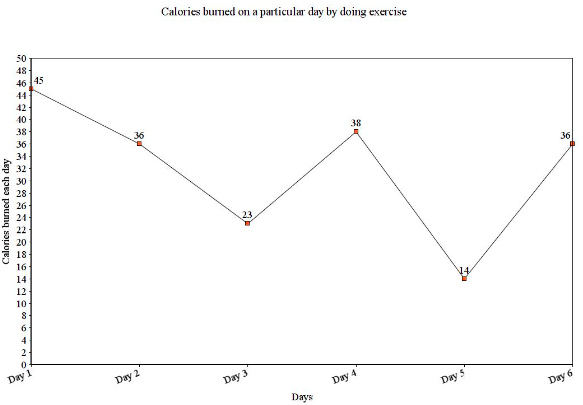
Explanation of the Graph
The graph shows that the highest calories were burnt on Day 1. On the other hand, Day 5 was the day where the lowest calories were burnt.
Now, let’s learn how to answer the questions based on an online graph.
Question 1: On which day the exercise has been done the most?
Answer 1: The highest calories were burnt on Day 1, which was the day the exercise was done the most.
Question 2: Which day shows the lowest calories burnt? How much?
Answer 2: Lowest calories were burnt on Day 5, i.e.14 Calories.
Analysis of Line Graph
Depending upon solved examples of line graph questions, we can read the line graph easily. The following points will explain how to read a line graph after solving a particular question.
- Observe and analyse both axes to know what they represent.
- Analyse values that are present on the straight line of the graph.
- To know the purpose of the line chart, study the repeated pattern of lines intersecting with each scale.
- This pattern of a line graph is helpful to give an idea about the trend.
Conclusion
In conclusion, it is crucial to analyse the graph correctly to solve the line graph problems quickly. Also, you can follow the steps mentioned above for quickly solving line graph problems.
Furthermore, you can practice on your own by solving the sample questions of the line graph given here. Learn to solve line graph problems using examples of line graph questions discussed above.