Profile
 Settings
 Refer your friends
 Sign out


In this article, we will learn about pie charts, learn the definition of a pie chart, see the steps of its construction and learn to construct one from the acquired knowledge. We will also be learning the formula for calculating data in a pie graph with the help of illustrative examples. There is also detailed information on the topic ”pie charts”. Let’s learn about this interesting topic with wonderful real-life examples. The article covers all the subtopics with absolute clarity. Happy learning!
Definition of pie graph:
A pie graph or pie chart is a circular, statistical representation of data. A circle is divided into several divisions to illustrate different proportions of data. Often, different data are represented by using different colours.
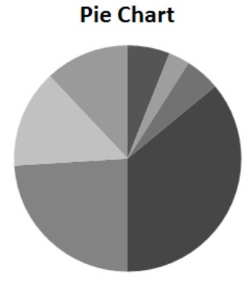
A typical pie-chart looks like this:
The formula for calculating pie graph data
The main work for representing data in a pie graph is the conversion of data into angle segments for representation within 360 degrees.
There are two ways of conversion of data to angle segments,
The percentage method:
In this method, the given data values are converted into percentages. The formula is:
percent= (Given data value)/100
Now, these obtained percentages are converted into angle segments by multiplying them by 360 degrees.
Numerically,
Angle segment=percent*360 degrees.
Direct method:
In this method, data values are not converted into percentages and are converted into angle segments by dividing a given data value by the total data value and then multiplying the result by 360 degrees.
Numerically,
Angle segment= (given data value)/(total data value)*360 degrees.
Steps for the construction of pie graph:
Let us look into the step-by-step process to construct a pie chart.
The steps are given below:
- Firstly convert the given data into percentages.
- Draw a circle with the help of a compass.
- Now, let’s convert the data percentages into angle segments.
- The data percentages are converted to angle segments by the formula,
Angle segment =(percentage value/100)*360 degree
- There is another way of representing data in a pie chart, directly through given data by the formula:
Angle segment= (Data value/total value of data)*360 degree
- Now, draw each angle segment in the drawn circle with the help of protractors and a compass.
- Mark different data with the help of different colours. This gives a clear differentiation of different data values and is easier for the viewer to access.
- Cross-check your pie chart with the given values to eliminate errors.
Uses of pie graph:
Pie graphs are used in several ways to represent data in fields of businesses to represent customer per cent, sales percentage, etc. It is also used in economic statistics to represent section-wise growth or division of the country.
Examples of a pie graph
Now that we know the steps to construct a pie graph.
- Draw a pie graph representing the strength of a class with 54 boys and 46 girls.
Ans: First, let’s convert the given data into angle segments using a direct method.
Therefore, angle segment of girls=(number of girls)/(total strength of class)*360 degrees
=(46/100)*360 degree
= 165.6-degree
angle segment of boys=(number of boys)/(total strength of class)*360 degrees
=(54/100)*360 degree
=194.4 degree
Now, we will draw these two angles in a circle and shade the areas covered with different colours.
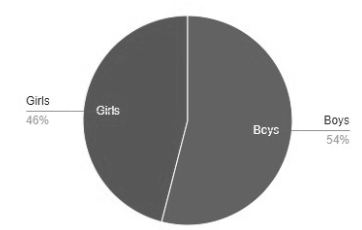
This is what the pie chart for the given question looks like.
- Three friends built a company with 45%, 24%, and 31% shares. Draw a pie chart to represent their shares.
Ans: Let us consider the three friends as A, B, and C.
Now, let us convert data into angle segments.
A’s angle segment=percentage value/100)*360 degree
=(45/100)*360
=162 degree
B’s angle segment=percentage value/100)*360 degree
=(24/100)*360
=86.4 degree
C’s angle segment=percentage value/100)*360 degree
=(31/100)*360
=111.6 degree
Now, let us represent this in a pie graph with different colours.
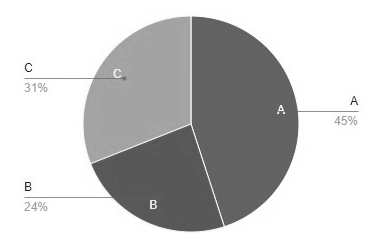
This is what the pie graph of the above question looks like.
Practice time!
Now that we have seen examples, let us solve a few problems for practice.
- In three years, a company has sales of 45%, 24%, and 31%. Construct a pie chart to show sales percentage.
- The GDP growth of a country in three years is 27%, 54%, and 19%. Construct a pie chart to show the percentage of GDP growth.
- A sum of one lakh rupees is divided into 36,000, 32,000 and 32,000. Construct a pie chart to show the division of money.
- The amount of rainfall in three different areas is 54cm, 24cm, and 22cm. Construct a pie chart for the given data.
Conclusion:
This article provides an elaborate explanation of pie charts. We started with the definition of a pie chart and saw how a typical pie chart is represented. Then, we focused on data conversions in a pie chart and learned two methods and forums to do so. Once done with data conversion, we learned to construct a pie graph through a step-by-step process. We have also acknowledged the various uses of pie graphs in our lives. Finally, to strengthen our understanding of what we learned, we have seen several examples and also practised some problems.