Profile
 Settings
 Refer your friends
 Sign out


In this article, we will learn about the definition of a pie chart and how to solve the question based on a pie graph through an example. We will also cover simple ways to do the calculation with numbers.
Definition of Pie Graph
A pie chart is an illustrative, circular statistical representation of data. In this, a circle is divided into several divisions to illustrate different proportions of data. Often, different data are represented by using different colours and the angle of each slice is expressed as
Angle = ( Given data value ) / ( total data value ) * 360 degrees
Sample Pie Graph Related Questions
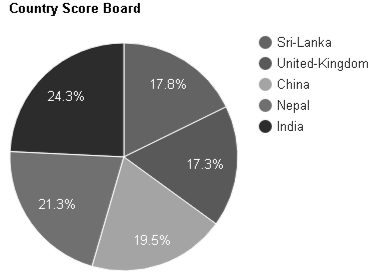
The following table shows the game score received by the countries in a tournament:
Country | Sri Lanka | The United Kingdom | China | Nepal | India |
Score | 71 | 69 | 78 | 85 | 97 |
Determine the angle at the centre of each component or slice.
Ans:
The given table represents the game score received by a country in a tournament.
Total score obtained by the countries = 400
Central angle for a each country = ( Country score / total countries score ) * 360°
Country | Score | Central Angle |
Sri Lanka | 71 | (71 / 400) * 360° = 63.9° |
United Kingdom | 69 | (69 / 400) * 360° = 62.1° |
China | 78 | (78 / 400) * 360° = 70.2° |
Nepal | 85 | (85 / 400) * 360° = 76.5° |
India | 97 | (97 / 400) * 360° = 87.3° |
Solved Examples of Pie Graph Problems
As an example, let’s look to get familiar with the concepts and what kind of questions can be formed and how to solve them quickly.
Question: Patna Junction has 12000 passengers travelling to different districts each day, which is represented below:
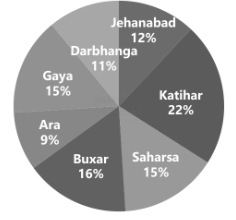
i) What percentage of passengers travelling to Buxar from Patna is greater than the percentage of passengers travelling to Jehanabad from Patna?
Ans: As per the pie chart, we see that 16 per cent of passengers fly from Patna to Buxar, whereas 12 per cent fly from Patna to Jehanabad. So, the required percentage of people more numerous than those travelling from Patna to Buxar can be calculated as
=( ( passengers % from Patna to Buxar – passengers % from Patna to Jehanabad ) x 100)/passengers % from Patna to Jehanabad
= ( ( 16 – 12 ) / 12 ) x 100 = 33.33 %
ii) When all three cities are combined, how many passengers travel from Patna to Saharsa, Katihar, and Buxar on average?
Ans: As per the pie graph, we can calculate the total percentage of passengers travelling to Saharsa, Katihar and Buxar.
(15% + 22% + 16%) = 53%
Now, the number of passengers who travelled can be calculated as 53% of total passengers, that is 53% of 12000.
= (53/100) * 12000 = 6360
Therefore, the average is 6360 / 3 = 2120
The number of passengers who travelled on average is 2120.
iii) If the passengers who travelled from Patna to Buxar are grouped together like a pie chart, determine the central angle?
Ans: To determine the angle for this question, we will state the given expression as
Angle = (given data value)/(total data value)*360 degrees.
So, the angle represents the passengers who travelled to Buxar from Patna, which can be determined as ( Patna to Buxar percentage / total percentage ) * 360°
= ( 16 / 100 ) * 360° = 57.6° degrees.
iv) What percentage of passengers travelling from Patna to Gaya make up the total number of passengers travelling from Patna to Darbhanga and Ara?
Ans: In the total of 100%, the percentage of passengers travelling between Patna and Gaya is 15 %, whereas the combined percentage of passengers travelling between Patna and Darbhanga and Ara is 11% and 9%, which in total is 20%.
So, the total percentage is 11% + 9% = 20%.
Now, the required percentage of passengers is calculated as
= 15 * 100 / 20
= 15 * 5
= 75 %
Hence, the total percentage of passengers is 75%.
Tips to Solve Pie graph Questions:
Calculate the percentage share of each element in the total for easy calculation because working on percentages is easier than handling large numbers.
The simplest approach to solving a problem is to round up the answer, per cent, or fractional equivalent to the nearest whole number or per cent. For instance, 67% = 2/3 and 28% of 1000 as (20 % of 1000 + 8 % of 1000).
Before you read the question, carefully examine every piece of writing on and around the pie chart, which is the largest slice, what’s the smallest slice, the total number of slices and which slice represents which amount.
Numbers may appear in a pie graph, but these numbers might not be percentages. You can see an explanation of the numbers by looking for the “%” symbol or a note at the bottom of the pie chart.
Conclusion
This article has provided elaborate details on how to solve pie-graph-based questions with the help of an example with different kinds of questions. We covered the tips that will help you make your calculation easier and quicker. We have also acknowledged the various uses of pie graphs in our lives. Finally, to strengthen our understanding of what we learned, we have seen solved examples more deeply.