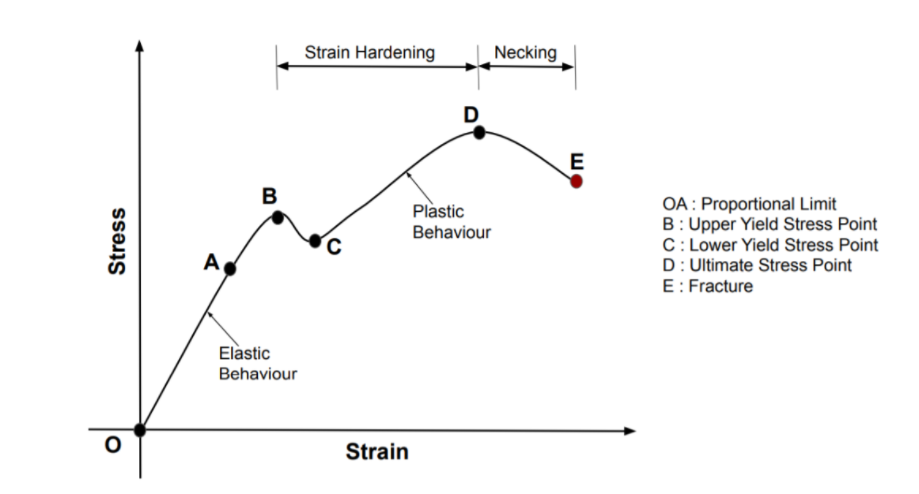
Definition of Stress-strain Curve:
Generally speaking, angles representing the relationship between stress and strain in any form of distortion can be regarded as stress-strain angles. Stress and strain can be normal, shear, or admixture, also can be uniaxial, biaxial, or multiaxial, indeed change with time. The form of distortion can be contraction, stretching, torsion, gyration, and so on. However, stress – strain wind refers to the relationship between axial normal stress and axial normal strain of accoutrements measured in a pressure test.
Stress-strain in Engineering:
Consider a bar of original cross-sectional area A0 being subordinated to equal and contrary forces F pulling at the ends so the bar is under pressure. The material is passing a stress defined to be the rate of the force to the cross-sectional area of the bar, as well as an axial extension-
σ=F/A0.
ε=L-L0/L0
=∆L/L0.
Here 0 denotes the original confines of the sample. The SI unit for stress is Nm2, and strain is unitless. Stress-strain wind for this material is colluded by protracting the sample and recording the stress variation with strain until the sample fractures. By convention, the strain is set to the x axis and stress is set to the y axis. The curve grounded on length and cross-section area is called the true stress-strain curve.
True Stress and strain:
Due to the revulsion of section area and the ignored effect of developed extension to further extension
σt=FA.
εt=δL/L.
Assuming volume of the sample conserves and distortion happens slightly
A0L0=AL.
The true stress can be expressed by
σt=F/A=F/A0.
A0/A=F/A0.L/L0=σ(1+ε).
For the strain , δεt=δL/L.
Integrate both sides and apply the boundary condition,
εt=ln ln (L/L0)=In ln (1+ε).
As for the tensile strength point, it’s the minimal point in engineering stress-strain wind but isn’t a special point in true stress-strain wind. The criterion for necking conformation can be set as δF=0
δF=σtδA+Aδσt=0.
-δA/A=δσt/σt.
After this the stress and strain at the necking can be expressed as:
σt=FAneck.
εt=In ln (A0/Aneck).
An empirical equation is generally used to describe the relationship between true stress and true strain is σt
=K(σt)n here n is the strain-hardening measure and K is the strength measure.
Stages in Stress-Strain Curve:

There are several stages showing different actions, which suggests different mechanical parcels.
- Proportional Limit (O-A): Proportional limit is the point at the curve up to which the value of stress and strain stays proportional. From the Stress-Strain Curve,point A is referred to as the proportional limit point or it may be also referred to as the limit of proportionality. The stress up so far may be referred to as proportional limit stress.
- Elastic Limit(O-B): Elastic limit is the limiting value of a strain up to which the material is flawlessly elastic. From the curve, point B is the elastic limit point. Material will go back to its initial position, If it is unloaded before the crossing of point B. This is so, due to the fact that the material is flawlessly elastic up to point B.
- Yield Stress Point:Yield stress is described as the strain after which material extension takes place much faster without any increase in load or with little increase in load. Point B is the upper yield point on the graph and Point C is the lower yield point.
- Ultimate Stress Point:Ultimate stress point is the maximum power that material needs to bear stress before breaking. It can also be described as the ultimate stress corresponding to the peak point in the stress strain graph. On the graph point D is the ultimate stress point. After point D material has very minute or 0 power to withstand more stress.
- Breaking Stress (Point of Fracture):Breaking point or breaking stress is the point at which strength of material breaks. The stress at the breaking point is referred to as breaking strength or rupture strength. On the stress strain curve, point E is the breaking stress point.
Classification of Stress-strain:
- The ductile materials
- The brittle materials
Types of Stress-strain curve: –
- Tensile strain.
- Compressive strain.
Uses: –
It is a graphical representation of the used material’s strength and elasticity and helpful to understand the behaviour of the materials.
Stress and Strain Relationship
Stress and strain have a straight proportional relationship up to an elastic limit and it is explained by Hooke’s law which states that the strain in a solid is proportional to applied stress.
 Profile
 Settings
 Refer your friends
 Sign out


