 Profile
 Settings
 Refer your friends
 Sign out


The concept of sets can be extended to include the visual representation of the relationships and operations performed between two sets. Named after the English logician John Venn, the Venn diagrams make use of closed curves like rectangles and circles for the purpose of visual representation. For the application of the Venn diagrams, one must know that Venn diagrams are used to represent similarities and differences between the two sets or groups of things.
The logician named John Venn first used the concept of Venn diagrams back in 1890, in his paper “On the Diagrammatic and Mechanical Representation of the Propositions and Reasonings.” However, the experts say that the concept of Venn diagrams has been around since the 13th century. Venn diagrams are extensively used in probability.
Venn Diagrams
A classic Venn diagram looks something like this:

The U represents the universal set and the A represents a set denoted by the letter A.
Venn diagrams can take different forms dependent on the set operations they are representing.
Union of Sets
The union of the sets lists down all the elements included in the given number of sets, taking the common element only once.
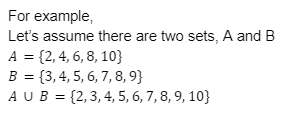
The Venn diagrams for the union of sets will be represented as:

The shaded portion is referred to as AB
In the case of three sets, the Venn diagram will take the following form:

From the above two diagrams, one can algebraically as well as visually manipulate the sets to confirm the following algebraic laws:
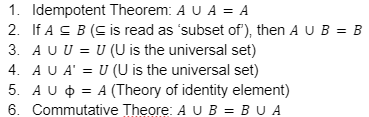 Following is the formula for Venn diagram used for representing the unions of the set:
n(A∪B)=n(A)+n(B)-n(A ∩ B)
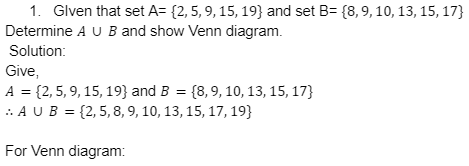
For making a Venn diagram to represent a union, theoretically shade the circles that represent the sets. When it comes to represent the sets numerically, put the elements of the set in their respective circles. Take care that the common elements are being put in the area where the two are intersecting, as those elements are common to both the sets.
Solved Example:

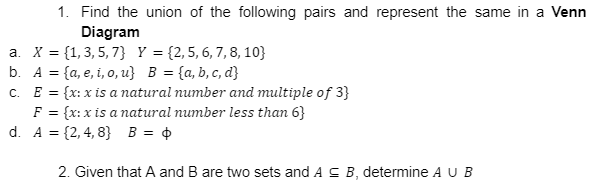
Practice Questions
Intersection of Sets
The intersection of two sets results in a set that contains the common element of the two sets.
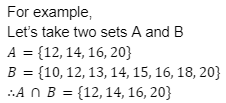

The shaded portion represents AB
In case there are three sets, the Venn diagram will take the following shape:

The shaded portion represents the intersection of three sets A,B and C (A∩B∩C)
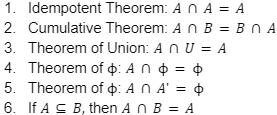
From the above two diagrams, one can algebraically as well as visually manipulate the sets to confirm the following algebraic laws:
Solved Example
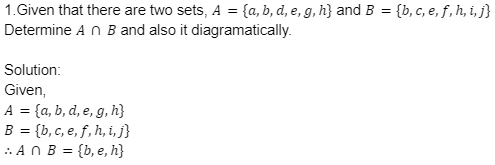
Diagramtically,

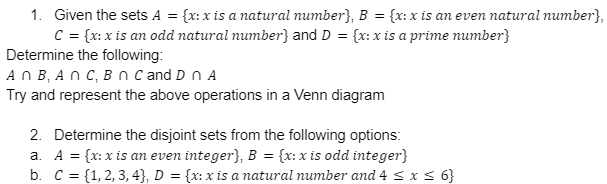
Practice Questions
Other Forms of Venn Diagrams
Subset of a Set
The subset of set is mathematically defined as the case when the Set B contains few or all elements of Set B. Symbolically,
AB
The venn diagram in this case takes the following form:

Complement of Set
The complement of a set A refers to the set which contains elements other than that in the Set A from the universal set. Complement of Set A is A’.
The venn diagram takes the foll

Conclusion
First used in 1890, the Venn diagrams are extensively used in probability, statistics and other fields to visually represent the relationship between sets. The Venn diagrams make use of the closed figures like rectangles and circles to visually represent the relevant relationships. One can use the venn diagrams to represent the union, intersection, complement or subset amongst many other operations performed in sets.


