Profile
 Settings
 Refer your friends
 Sign out


Equation
In mathematics, an equation is a mathematical expression that expresses the equality of two expressions consisting of variables and/or numbers.
For example: 2x+6=20
In every mathematical equation, we have,
L.H.S = R.H.S (left hand side = right hand side).
Parts of an equation:
Coefficients
Variables
Operators
Constants
Terms
Expressions
Equal sign ( = )

Polynomial equation:
Equations in the form P(x) = 0, are called polynomial equations, where P(x) is a polynomial. These types of equations are also known as equivalent equations because both sides of the equation have the same solution.
Types of polynomial equation:
1. Linear equation: An equation whose degree is one is called a linear equation.
The standard form of linear equation is ax + b = 0, where a ≠ 0.
For example: 2x + 5 = 0
The graph of a linear equation will always be a straight line.
The degree of linear equation will always be 1.
Graph of linear equation: 2x + 5 = 10

The solution of given linear equation is x = 2.5
2. Quadratic equation: An equation whose degree is two is called quadratic equation.
The standard form of linear equation is ax2+bx+c=0, a≠0.
For example: x2-x-2=0
The graph of a quadratic equation will always be parabolic.
The degree of quadratic equation will always be 2.
x2-x-2=0
x2-2x+x-2=0
x(x-2)+1(x-2)=0 →(x-2)(x+1)=0

The graph intersects the x-axis at two points x = -1 and x = 2, so both the values of x is a solution of a given quadratic equation.
Linear equation in two variables:
An equation expressed as ax + by + c = 0 is called a linear equation in two variables, where a, b and c are real numbers and both a and b are not zero.
The general form of pair of linear equations in two variables x and y is:
a1x+b1y+c1=0
a2x+b2y+c2=0
Where a1, b1, c1, a2, b2, c2 are all real numbers.
Example of pair of linear equation in two variables:
2x-3y+6=0
3x+5y-10=0
Trigonometric equation
Trigonometric equations are the equations using the trigonometric ratios. The solution of trigonometric equations can be found graphically as well as analytically.
For example, sin x+cos x-1=0 is a trigonometric equation. The equation says that the value of sin is equal to negative to the value of cos at some angle.
So, the solution of the equation should be x=n-4 where n is any integer.
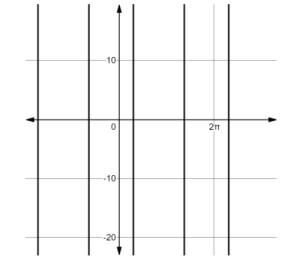
The graph of the given equation can be represented as,

Solving the trigonometric equation using graphs
To solve any trigonometric equation using the graph, we need to draw the graph of each trigonometric function present in the equation. Then, we have to find out the points which satisfy the condition of the equation.
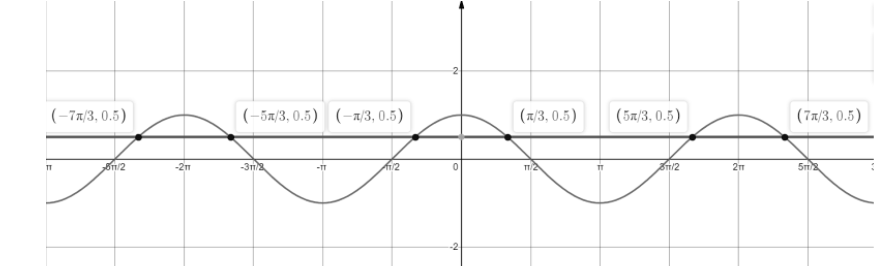
For example, sin x=0.5 is a trigonometric equation. We need to find the solution of the equation such that the value of sin x will be 0.5. So, plot the graph of sin x and draw a line y = 0.5 which is parallel to the x-axis. The point of intersection of these two graphs will give the solution of the given equation.
The graph representing the solution will be,


The above graph represents that the solution of the equation will be (2n+6)(n-6).
Some examples to find the solution using graph
Example 1: Solve 3x – 2y -4 = 0 and x + y – 3 = 0.
Graph of the equation 3x – 2y -4 = 0 and x + y – 3 = 0 is,

From the graph, the solution of a pair of linear equations is unique.
x = 2 and y = 1.
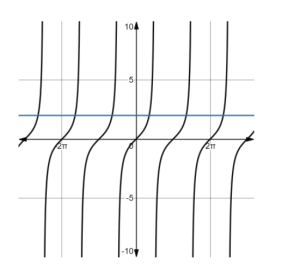
Example 2: Find the solution of the equation tan x=1.
We need to find the solution of the equation such that the value of tan x will be 1. So, plot the graph of tan x and draw a line y = 1 which is parallel to the x-axis. The point of intersection of these two graphs will give the solution of the given equation.
The graph representing the solution will be,

The graph represents that the two curves intersect at several points. So, the point of intersection is the solution which can be represented graphically as,

Thus, the solution of the given equation is x=n+4 where n is any integer.
Conclusion
A graph is a powerful tool to find the solution of equations. By plotting the graph of trigonometric ratios, we can find the solution of the trigonometric equation very easily. It also provides a visual of the solution.