Profile
 Settings
 Refer your friends
 Sign out


We can determine any data set’s central location by describing the data set. In statistical terms, this is called the central tendency.
The mode is a common measure of central tendency; it is the frequency at which a given number occurs in a series of values. Derived from the French word ‘La Mode’ (meaning: fashionable), it is also sometimes known as ‘modal value’.
It is one of the most useful measures of central tendency and comes in handy, especially when dealing with categorical data. A dataset can have only a single mode, more than one mode, or even no mode at all.
What is Mode?
As stated above, the mode is the value that appears the maximum number of times in a series.
Statistics is a field that deals with the collection, sorting, and analysis of both grouped and ungrouped data. A statistician then presents this data in a format that everyone can easily understand.
To that end, we often use a single value to represent an entire series of data, which is known as ‘mode’.
Like all the other measures of central tendency, it too helps us create a detailed summary from the vast amount of large, complex data.
Example: In a given set of values, say {2,4, 6, 8, 6, 9, 10}; the mode for this series shall be 6.
Why?
Because in the above series, 6 is the only number that appears a maximum number of times.
Types of Mode
We can classify the mode into three types based upon its occurrence in a dataset. They are as follows:
Unimodal mode
It derives from the Latin word ‘uni’, which means one. In simple words, a ‘unimodal mode’ only has a single mode.
For example, in a set A, the values are as follows: [12, 15, 12, 14, 9, 12, 8].
Here, only one number is being repeated in the series. Hence, this series is a ‘unimodal data set’.
Bimodal mode
Originating from the Latin word ‘bis’, this is a set of data with two modes, considered a bimodal model. It means that two values have the highest frequency.
For example, in a set A, the values are as follows: [12, 12, 12, 14,14,14, 9, 11, 8].
Here, two numbers (12 and 14) repeat thrice.
Trimodal mode
As evident from the name, a data set with three modes with the highest frequencies is a ‘trimodal mode’.
For example, in a set A, the values are as follows: [12, 12, 12, 14, 14, 14, 9, 9, 9, 11, 8].
Here, three numbers (12, 14, and 9) repeat thrice in the series.
Multimodal mode
A data set with four or more modes will be known as ‘multimodal mode’.
What is the Mode Formula?
While there is no specific formula for calculating the mode of an ungrouped series, we can define the mode for various types of data using the formula discussed below.
Case 1: Ungrouped Data
For a set of ungrouped data, find the observation that appears the most often.
Mode = Maximum number of observations
For instance, data such as [6, 8, 9, 3,4,6,7,6,3] shows that the number 6 occurs the most often. Thus, the mode is 6.
Mode is thus a simple method to remember the most often entered data. As discussed above, we may classify data according to the number of modalities it possesses. Because there is just one mode in the above example, we may say that it is unimodal.
Case 2: Grouped Data
We may use the following procedures to discover the mode while the data is flowing continuously:
Step 1: Identify the modal class, which is the one with the greatest number of members.
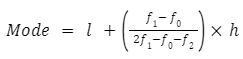
Step 2: Use the following formula to determine the mode:
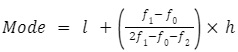
where,
l = modal class lower limit
f0 = frequency of modal class
f1 =Frequency of class preceding modal class
f2 = frequency of class succeeding modal class
h = class width
The Relationship between Median and Mode
The following equation expresses the intimate link between the mean, median, and mode. It is an empirical relationship.
3.Median = 2.Mean + Mode
We can use several formulae to derive these values, such as the formulas covered in the previous sections. We can use an empirical relation to determine the mode of continuous grouped data.
For instance, we have data with a median of 61.6 and a mode of 65. Once we have the median and mode, we can use that information to calculate the mean.
Two averages and one mode equals three medians.
2Mean = 3 x 61.6 – 65
It is 119.8.
119.8/2 =59.9
59.9 is the average value.
Conclusion
There are three central tendency measures: the Mean, the Median, and the Mode. We can find a data set’s mode by determining the number that appears most often in a series of values.
So, this article was all about the most common measure of central tendency used in statistics (mode). We covered the meaning of mode, its types, and dived deep into how you can calculate the mode for different types of grouped and ungrouped data.