 Profile
 Settings
 Refer your friends
 Sign out


When both sides of an equation are not equal in value, then the comparison between both sides of that equation is expressed by an inequality.
The significant difference between solving an equation and solving inequality is that the solution of an equation is a single value, but the solution of inequality is a range of values; that is why when we write an inequality, we represent them using the following symbols:
- > (greater than)
- < (less than)
- > (greater than or equals to)
- < (less than or equals to)
One-step Inequalities and Solving Them With a Graph
One-step inequalities are inequalities that require only one step to obtain the solution. We can understand this through a few illustrations:
Illustration 1
x-7 4
To solve this set of inequality, we will take try to eliminate 7 from the inequality by adding it to both sides of the expression:
x-7+74+7
Now when we solve the above expression, we get
x11
Illustration 2
z12>132
Again, to solve this set of inequality, we will take try to eliminate 12 from the inequality by dividing both sides of the inequality by 12:
z1212>13212
Now when we solve the above expression, we get
z>11
Illustration 3.
y-23<7
Again, to solve this set of inequality, we will try to eliminate 23 from the inequality by subtracting both sides of the inequality by 23:
y-23+23<7+23
Now when we solve the above expression, we get
y<30
So, as we can see through the above set of illustrations, all these inequalities are solved by using only one step; we just identified the value that we had to eliminate to achieve the outcome and then performed one step of addition, subtraction, or any other mathematical operation to eliminate the value, and got the result we wanted. This is why such inequalities are called one-step inequalities since they require only one step to obtain the solution.
Now, we will see how these one-step inequalities are solved and are represented on a graph or a number line.
Unlike equations and inequalities, the solution of an inequality is not a single value. Instead, it is a range of values, and if we replace the variable with any value from that range, the statement remains true. So, to represent an inequality on a graph or number line, we have to display its complete range.
To represent any inequality on a number line, we must first mark the starting value with the value we have remaining on the right side of the inequality. Then, depending on the inequality symbol, we mark the left or right of the graph or number line. We can understand this concept through the following illustrations:
Illustration 1
x+7<12
Again, to solve this inequality set, we will try to eliminate seven from the inequality by subtracting both sides of the inequality by 7.
x+7-7<12-7
Now, when we solve the above expression, we get
x<5
Now we have to represent this inequality on a graph or number line. For this, we have to mark five on the graph or the number line, and since the inequality symbol used is < (less than), we will mark its range by marking the left side of the number line starting from 5.
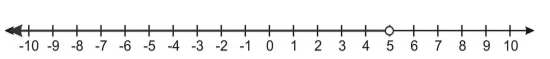
Illustration 2
x+6≤-9
Again, to solve this inequality set, we will try to eliminate six from the inequality by subtracting both sides of the inequality by 6.
x+6-6≤-9-6
Now when we solve the above expression, we get
x≤-15
Now we have to represent this inequality on a graph or number line. For this, we have to mark -15 on the graph or the number line, and since the inequality symbol used is (equals to or less than), we will mark its range by marking the left side of the number line starting from -15.

Illustration 3
x+11>20
Again, to solve this inequality set, we will try to eliminate 11 from the inequality by subtracting both sides of the inequality by 11.
x+11-11>20-11
Now when we solve the above expression, we get
x>9
Now we have to represent this inequality on a graph or number line. For this, we have to mark nine on the graph or the number line, and since the inequality symbol used is > (greater than), we will mark its range by marking the right side of the number line starting from 9.

Illustration 4
x+12<17
Again, to solve this inequality set, we will try to eliminate 12 from the inequality by subtracting both sides of the inequality by 12.
x+12-12<17-12
Now when we solve the above expression, we get
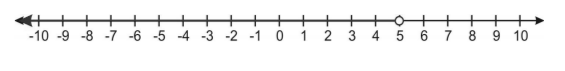
x<5
Now, we have to represent this inequality on a graph or number line. For this, we have to mark five on the graph or the number line, and since the inequality symbol used is < (less than), we will mark its range by marking the left side of the number line starting from 5.
Conclusion
Inequality is a mathematical expression used to represent mathematical statements where the variable has a range of values instead of a single value. These expressions are expressed using inequality symbols like >, <, ≥, and ≤.
One-step equations are equations that are solved using one step only.
To represent an inequality on a graph or the number line, we have to first mark the value on a chart or the number line and then mark along with the graph or the number line on either side depending on the inequality symbol.


