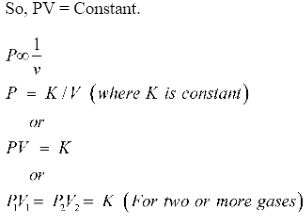
Boyle’s law says that the volume occupied by a constant mass of a gas at a given temperature is inversely proportional to the volume. V (T and n are constants) When the pressure of the gas rises, the volume drops, and when the pressure of the gas falls, the volume rises.
So, PV = Constant.

Graphical Verification of Boyle’s Law
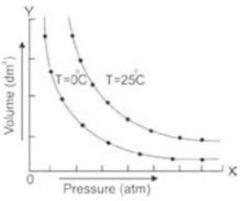
- Take a certain amount of gas and place it in a cylinder with a piston at a consistent temperature of 0°C. When a gas’s pressure changes, its volume changes as well. As the pressure rises, the volume decreases. Drawing a graph with pressure on the x-axis (abscissa) and density on the y-axis yields a curve (ordinate). An isotherm is a name for this curve. The terms “therm” and “iso” both refer to heat. Increase the air temperature to 25 degrees Celsius.
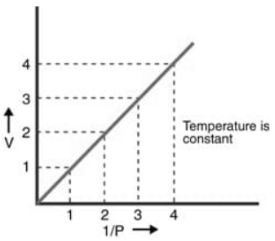
- At a fixed temperature, the variation in volume (V) is displayed versus (1/P): The result is a straight line that passes through the origin.
Maintain a constant temperature while varying the pressure and volume, and plot the isotherm. It is oriented away from both axes. The reason for this is that the volume of the gas has expanded as the temperature has risen. Similarly, increasing the temperature level, making it continuous, and plotting another isotherm causes it to move further away from the axis.

At a fixed temperature, the variation in volume (V) is displayed versus (1/P): The result is a straight line that passes through the origin.
- A straight line is obtained by plotting the chart between 1/V on the x-axis and the pressure P on the y-axis. This demonstrates that pressure and the inverse of volume are exactly related. This straight line will meet at the origin, indicating that when the pressure is extremely close to zero, the volume is extremely high, and the opposite is extremely close to zero. Pressure and volume may be varied by altering the thermal environment of the very same gas from T1 to T2 while maintaining it constantly.
PV vs P
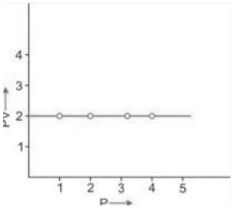
PV variation as a function of the pressure (P) at a constant temperature: The result is a straight line corresponding to the X-axis.
Make a graph with the x-axis representing pressure and the y-axis representing the product PV. The result is a straight line parallel to the pressure axis. This straight line indicates that ‘k’ is a constant. Due to the growth in volume at the same pressure, the volume and value of the product PV must rise at a higher consistent temperature; nevertheless, PV remains constant at this new temperature level, and a straight line corresponding to the pressure axis is obtained.

Graphical Method for Verification of Boyle’s Law
Let’s take a certain amount of a gas at a fixed temperature, say 0 degrees Celsius, and confine it in a cylinder with a piston. The volume of a gas varies when its pressure changes. The volume reduces as the pressure rises. A curve is generated by drawing a graph with pressure on the x-axis (abscissa) and volume on the y-axis (ordinate). This curve is known as an isotherm since “iso” means “the same” and “therm” means “heat.” Raise the pressure of the gas to 25 degrees Celsius.

Maintain this temperature while varying the pressure and volume and plotting the isotherm. It is oriented away from both axes. The reason for this is that the volume of the gas has increased as the temperature has risen. Similarly, increasing the temperature level, making it continuous, and plotting another isotherm causes it to move further away from the axis.

A straight line is obtained by plotting 1/V on the x-axis and pressure P on the y-axis on a chart. This demonstrates that pressure and the inverse of volume are exactly related. This straight line will meet at the origin, indicating that when the pressure is extremely close to zero, the volume is extremely high, and the opposite is extremely close to zero.
Pressure and volume may be varied by altering the ambient temperature of the very same gas from T1 to T2 while maintaining it constantly. Another straight line will emerge from the graph of this data between P and 1/V. T2 will have a straight line that is closer to the pressure axis.
Conclusion
Overall, the graphed examination of Boyle’s original data clearly reveals that his conclusion that pressure and volume are inversely related assuming constant temperature is correct. It shows how the pressure rises as the volume decreases. Also, indicates that when one variable is compared to its inverse, a linear function is produced, as indicated in the graph. Implying that Boyle’s Law is valid and pressure is inversely proportional to volume or vice versa.
 Profile
 Settings
 Refer your friends
 Sign out


