 Profile
 Settings
 Refer your friends
 Sign out


The term “psychrometrics” refers to the study of the physical and thermodynamic properties of mixtures of gas and vapour. In this context, “properties of moist air” refers to a mixture of water vapour and air, and it is important to human comfort and the conditions in the built environment that it creates. Changes in the properties of the moist air can occur during both the humidification and dehumidification processes. These changes can occur with or without the exchange of heat or matter between the air and its surroundings, respectively, and are referred to as isothermal or adiabatic processes. The air that is all around us is made up of a combination of dry air and damp air, and it also has a certain amount of heat in it. When discussing the current state of the weather, it is common practice to mention the air temperature, the relative humidity, and the dewpoint. A psychrometric chart details all of these qualities as well as others, among other things. The structure of the chart and its level of complexity requires some to get accustomed to. You will find that the wet-bulb temperature, dry-bulb temperature, and dewpoint temperature can all be represented by the same temperature scale that is located along the upper curved boundary of the chart. This upper curving limit also denotes a relative humidity of one hundred percent, sometimes known as “saturated air.”
Constant Enthalpy
At a constant pressure, which is conveniently provided by the huge ambient atmosphere, it is a state function that is employed in many measurements involving chemical, biological, and physical systems. The term “pressure-volume” is used to describe the amount of effort that must be expended in order to determine the system’s physical dimensions, also known as “making room for it by displacing its surrounds.” At typical temperatures and pressures, the pressure-volume term is negligible for both solids and liquids, and it is only moderately significant for gases. As a result, enthalpy can be thought of as a substitute for energy in chemical systems; bond, lattice, and solvation energies, along with other so-called energies in chemistry, are essentially just changes in enthalpy. Since enthalpy is a state function, it is solely dependent on the ultimate configuration of internal energy, pressure, and volume; it does not depend on the path that was taken to arrive at that configuration.
Within the framework of the International System of Units (SI), the joule is the SI unit of measurement for enthalpy. The calorie and the British thermal unit are two more historically significant conventional units that are still in use today (BTU).
Constant Enthalpy Lines on T-s Diagram
Property diagrams are the most frequent way to display information regarding the phases of material as well as the relationships between its qualities. There have been numerous different properties defined, and some of these properties are dependent on one another in certain ways.
A temperature-entropy diagram, also known as a T-s diagram, is the sort of diagram that is utilised for energy transfer system cycle analysis the majority of the time. In the field of thermodynamics, it is employed to show shifts in temperature as well as specific entropy throughout the course of a thermodynamic process or cycle.
On the T-s diagram, the amount of work done by or on the system as well as the amount of heat added to or withdrawn from the system may be seen graphically. According to the scientific definition of entropy, the amount of heat that is moved into or out of a system is equal to the area that is under the T-s curve that represents the process.
Q = TdS
On a T-s diagram, the line representing an isentropic process is portrayed as being vertical, whereas the line representing an isothermal process is depicted as being horizontal. Isentropic refers to a state in which compression acts as a pump, while compression in a compressor and expansion in a turbine both involve compression. In light of the fact that these devices are utilised inside the thermodynamic cycles of power plants, it is very valuable in the field of power engineering.
It is important to keep in mind that the isentropic assumptions can only be used with ideal cycles. Because of their inability to be completely efficient, real thermodynamic cycles always result in some waste of energy.
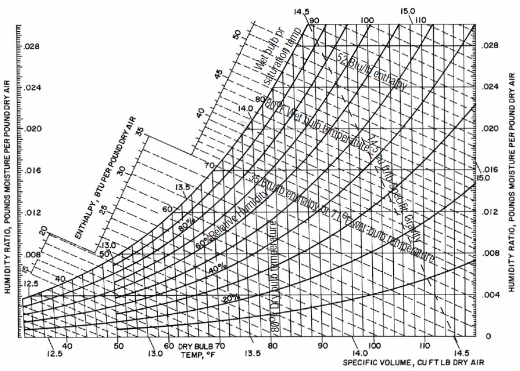
Enthalpy Line on a Psychrometric Chart
Within the psychrometric chart, the enthalpy scale is located in a section that is separate from the main body. The enthalpy scale is where the constant enthalpy lines begin and continue their descent toward the right side of the chart. To calculate the enthalpy of a sample of air, one must first determine its temperature at the wet bulb level (WB). Atmospheric pressure is used as the basis for all calculations in the psychrometric chart, which indicates the properties of air at that pressure. When it comes to the other pressures, the appropriate modifications need to be applied. The psychrometric chart is designed in the shape of a shoe.
A psychrometric chart is a graph that has an unusual shape and contains a lot of information. The chart’s utility will become more apparent if we analyse its constituent parts in the order in which they are presented. The psychrometric chart has three boundaries: a dry-bulb temperature scale on the horizontal axis, a humidity ratio (moisture content) scale on the vertical axis, and an upper curved boundary that represents saturated air or 100 percent moisture-holding capacity. The dry-bulb temperature scale is located on the horizontal axis, and the humidity ratio scale is located on the vertical axis.
Conclusion
A psychrometric chart is a graph that has an unusual shape and contains a lot of information. The chart’s utility will become more apparent if we analyse its constituent parts in the order in which they are presented. The psychrometric chart has three boundaries: a dry-bulb temperature scale on the horizontal axis, a humidity ratio (moisture content) scale on the vertical axis, and an upper curved boundary that represents saturated air or 100 percent moisture-holding capacity. The dry-bulb temperature scale is located on the horizontal axis, and the humidity ratio scale is located on the vertical axis.
