Introduction
In engineering, a moody diagram shows an important chart which is also called Stanton diagram and which is a mentioned graph of non-dimensional structure. In addition, this diagram mainly relates to “Darcy–Weisbach friction factor FD”, “Reynolds number Re, and surface on roughness” in order to develop a circular structured pipe. In 1944, Lewis Ferry Moody concocted with the mentioned factor which is mainly against Reynolds number and also against roughness. This chart is commonly known as two types such as Moody chart or Moody diagram. It mainly works with the adoption of Hunter Rouse and employed by Reginald J. S. Pigott who was an engineer and also a director of “Gulf Research & Development Company”.
Discussion
Moody’s diagram; flow through orifices
“Moody’s diagram; flow through orifices’, here with many fluid and mechanism problems, it could be defined as the first step which could be determined through “Reynolds number of the flow. In addition, calculations need a velocity number which helps in friction and if the calculation does not have velocity, then it has to take a velocity number to proceed as well. If calculation consumes a friction factor that can cover the answer correctly. According to this Moody Chart, if the Reynolds number has fallen towards “Laminar or Transition range” then it refers to an appropriate range that can help to examine all factors easily and give proper guidance of using all factors. After all, execution must examine and compute the roughness of this pipe and which is divided by the diameter of this pipe. In addition, a diameter of this pipe without roughness helps to get proper use of this friction factor. On the other hand, in “Moody’s diagram; flow through orifices”,this diameter must be unitless which can help match all units of roughness and diameter. Therefore, find a proper line that can help to refer to all roughness to the right side of this diagram which helps to get a proper result. In case this diameter has dimension or proper line this does not have any printed and parallel line. If those lines are states in these dimensions, then they both represent relatedness of roughness. It is also helpful to sketch lines in friction of factors.

Moody’s diagram example
Moody’s diagram example, here calculating as “4×10^4” of Reynolds number which is mainly for turbulent flow. So, in which another step is to follow this Moody chart and calculate mainly a relative roughness with 0.003. In this stage, sketch the main color and do the left then it turns a red line below. Then here it is needed to follow this red line until this Reynolds number is valued from before. In addition, this line mainly took straight, which is shown by this orange line until it reached the margin. After all execution, it comes to an effective and results in a value of 0.03.
Conclusions
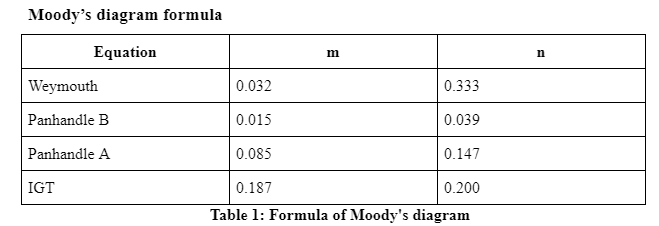
In this context, this study is mainly discussing the concept of “Moody’s diagram; flow through orifices”. It also includes the importance of this diagram and how this diagram works in every field. In addition, this study also states the formula of Moody’s diagram and uses it to calculate the friction of commercials. Here also discuss and conclude some procedures in which moody diagrams can be used and how can solve all issues in making such pipelines. With some solution steps, there also concludes an awareness of using such steps which can create numerous difficulties in the field of calculating value.
 Profile
 Settings
 Refer your friends
 Sign out


