Analysis of variance and covariance
What is a Variance?
In the field of Statistical Studies, Variance is defined as how far is the data of a given set spread. It is a way of measuring the gap or distance between the given number is a set or group and the recorded mean.
When carrying out research related to the market, variance is especially useful for estimating the probabilities of events in the future. Variance is an amazing method used to determine all or most of the distinct combinations and potential outcomes that a random variable could have within a given range.
A variance value of zero indicates that all of the values in the set of data are identical, whereas all variances which are not equal to zero are positive numbers. The greater the variance, the greater the spread in the set of data.
A higher variance indicates that the estimated value in a given set is very much out of reach from the average and one another. A small variance indicates that the numbers are pretty close in value.
Calculation of Variance
Variance is found by squaring the difference between every number in a data collection and the mean, dividing the total of the resultant squares by the number of values in the data set.
The known formula for variance is-
σ2 = Σ ( x – ∏)N
In the above-given formula,
‘x’ represents an individual data point.
‘∏’ represents the data point’s mean value.
‘N’ represents the total data point numbers.
Disadvantage of Variance
One of the drawbacks of variation is that it lends extra weight to statistics that are far from the mean.
Advantage of Variance
One of the key benefits of variance is that it handles all the deviations from the data set’s mean in the same way, irrespective of direction.
What is a Covariance?
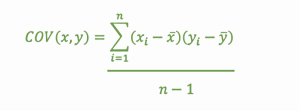
Covariance reveals how two variables are correlated to one another. In the field of statistics, covariance is a measure as to by what ways two random variables in a given dataset change differently.
There are two types of Covariance:
- A positive covariance indicates that the two variables are linked and remain constant.
- A negative covariance shows that the variables are negatively connected, or move in opposing directions.
The formula used to calculate Covariance

In the above-given formula-
‘x’ represents an independent variable.
‘y’ represents a dependent variable.
‘N’ represents the number of the data points.
‘x̄’ represents the mean value of ‘x’.
‘ȳ’ represents the mean value of ‘y’.
Sample Variance
The expectation of difference of squares of the given data points from the data set means is described as sample variance.
The dispersion of data points in a particular data collection around the mean is measured by sample variance. The population is the sum of all observations of a group.
Considering that a given data can be clustered or ungrouped, there are two formulae available to determine the sample variance.
Furthermore, the sample standard deviation is calculated by taking the square root of the sample variance. In this post, we’ll go over sample variance, its calculations, and several instances.
When the number of observations increases, calculating the population variance gets more complicated. In such a case, several observations are chosen that may be utilized to characterize the entire group. This particular set of data is a sample, and the variance determined is the sample variance.
It is an accurate measure of dispersion that is used to examine the divergence of data points from the average of the data.
The formula used to find the sample variance of a given set is-
S2 = xi- x n-12
In the given formula above-
S2 – Sample Variance.
xi – Value of only one observation.
x̄ – Mean value of all the observations.
n – Number of observations.
Conclusion
Variance and Covariance are of great use in various mathematical concepts. Not only in mathematics but this topic also helps to form a foundation for derivative problems in Statistical Mathematics and Analytical Studies.
Variance is an extremely easy method that is used to determine all or most of the differentiable combinations and possible outcomes that a random variable can have within a given range.
If an individual knows how to solve, derive and progress with any numerical based on covariance and variances then his/her statistical knowledge will surely be boosted.
Variance and covariance-based problem solutions are super easy to understand and grasp and, less time-consuming if known the basics perfectly.
 Profile
 Settings
 Refer your friends
 Sign out


