 Profile
 Settings
 Refer your friends
 Sign out


The phenomenon in which an object’s position generally changes over time is referred to as motion in the branch of science known as physics. Motion is mathematically described in terms of distance, displacement, velocity, plus acceleration, rather than speed and time. When we talk about an object that moves at a constant speed in a specific direction at regular intervals of time, we are referring to uniform motion. For example, we can say that a bike is moving in a straight line at a constant speed.
Distance time Graph
Consider the following graph (given below): a distance-time graph in which the body moves with uniform motion. When a body covers the same distance in equal time intervals, it is said to be in uniform motion. If we consider a time interval of one second, we can say that if a body covers ten metres in the first one-second, it should cover ten metres every second after that.
This entire sequence will indicate that the body is moving in a consistent manner. Let’s draw or call it a graph for uniform motion.
As in uniform motion, the graph of distance-time would be a straight line because equal distances are covered in equal units of time.
Examples of Distance time graph
Examine the graphs below and try to notice the nature of the body’s movement –
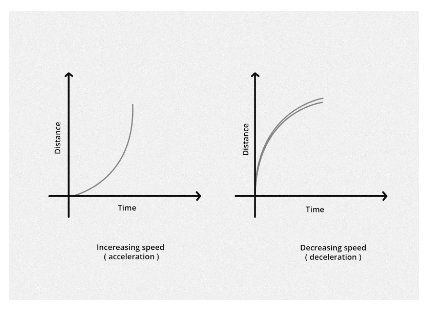
The curve line in the distance vs. time graph is clearly moving upwards in the first figure. This indicates an increase in speed, which is also known as acceleration.
In the meantime, the curve in the second image bends downward. This indicates that the body’s speed is slowing. In layman’s terms, this downgrade denotes the object’s deceleration. Speed can be easily calculated in both cases using the following two methods: Draw a tangent to the curve first, and then measure the gradient of the tangent.
We can also use the following formula to calculate the speed of the object:
Change in distance/change in time = speed
Aside from that, keep in mind that the velocity and vector quantity of the object change with magnitude and direction. These are crucial concepts to grasp when studying circular motion.
Speed time graph
- When describing the movement of an object, speed-time graphs are extremely useful.
- They can be used to determine whether or not an object is moving at any given point in time. We can also use them to determine the speed of the object at that point in time.
- We can calculate any acceleration, change in speed, and change in time using data from the graph.
- Graphs can also be used to calculate distance travelled.
Velocity time graph
Our investigation of 1-dimensional kinematics has focused on the various ways in which the motion of objects can be represented.
These methods include the use of words, the use of diagrams that are numbers, the use of equations, and the use of graphs.
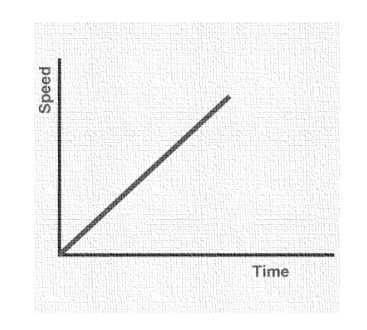
It is worth noting that a motion described as a positive changing velocity results in a sloped line when plotted as a velocity-time graph.
The positive slope line truly corresponds to the positive acceleration. Furthermore, we can see that only positive velocity values are plotted, which corresponds to a motion with a positive velocity.
This is a velocity time graph of an object moving north in a straight line.
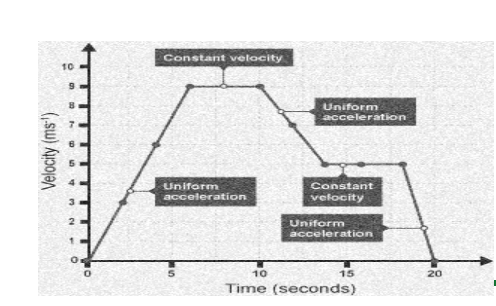
The area of the velocity time graph represents the displacement of this object. To calculate the displacement, we must first compute the area. This entails dividing the “area” into a series of triangles and rectangles, from which we can calculate the overall displacement. The displacement in this case is 118m.
In this case, the object begins at rest and accelerates for 6 seconds. It maintains a constant velocity of 9ms-1 for 4s before slowing to 5 ms-1 in another 4s. I travel at 5 ms-1 for another 4s before rapidly slowing down and coming to a stop.
If the line on the graph slopes downward from left to right, it indicates that the object is slowing down.
This is sometimes referred to as a ‘deceleration.’ However, keep in mind that a ‘deceleration’ is simply a type of ‘acceleration.’ It is a type of acceleration in which the object’s speed decreases over time.
Conclusion
In physics, the distance-time graph is crucial in calculating various values associated with motion. Time, speed, and distance are the three most important elements to discuss when learning about the distance-time graph. The Velocity-time graph is the graph that explains velocity in relation to time. Acceleration is controlled by the slope of a Distance time graph uniform velocity. When a graph of distance versus time for an object moving with accelerated motion, i.e. with increasing non-uniform speed, the slope of the graph will not be a straight line. The distance-time graph is used to determine the position of an object at any point during the given time interval.


