Profile
 Settings
 Refer your friends
 Sign out


This article explains the exponential and logarithmic function by using the graphical method as it gives visual clarification of various functions. The first part of the article will discuss the exponential function graphically and the relationship among various graphs of exponential functions. The second part of the article will discuss the logarithmic function graphically and the relationship among various logarithmic functions. The last part of the article will compare the exponential function and logarithmic function.
Exponential Functions
A function of the form f(x)= px , where p > 0 is known as an exponential function. We can take three different cases as p = 1 , 0 < p < 1, p > 1 and plot the graph for different values of x.
Case 1 (p = 1) :
For p = 1 , f(x)= 1x. It gives a constant function f(x)= 1 for different values of x.
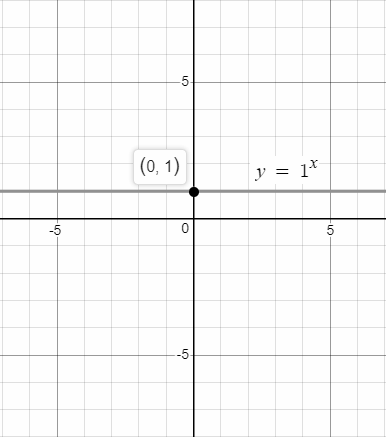
Graph of f(x)= 1x
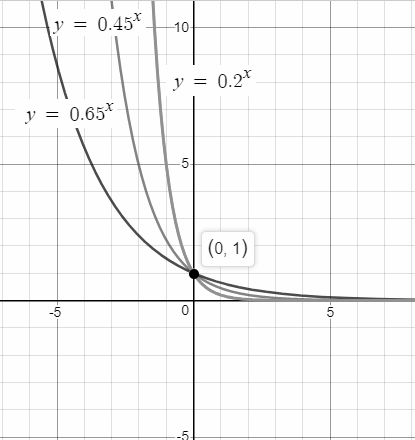
Case 2 (0 < p <1):
To understand this case, we will take p = 0.5, then the function takes the formf(x)= 0.5x.
The graphical representation of f(x)= 0.5x for different values of x is:

Similarly, graph can be plotted for different values of x by taking any particular value of p such that 0 < p < 1.
Case 3 (p > 1):
To understand this case, we will take p = 3, then the function has the formf(x)= 3x.

Similarly, graphs can be plotted for different values of p such that p > 0.

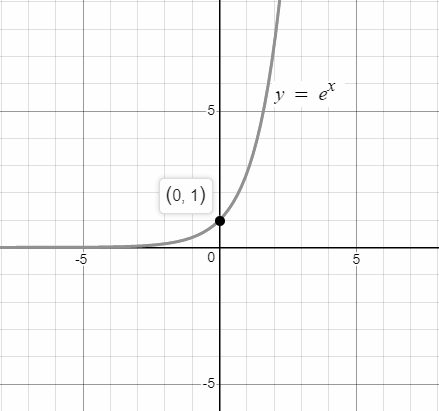
- Special case ( p = e ):
For p = e, f(x)= ex. So, on plotting graph for different values of x we have,
Comparison of Various exponential functions:
Graph of fx= 3x and f(x)= 3-x = (13)x

Graph of fx= ex and f(x)= e-x = (1e)x
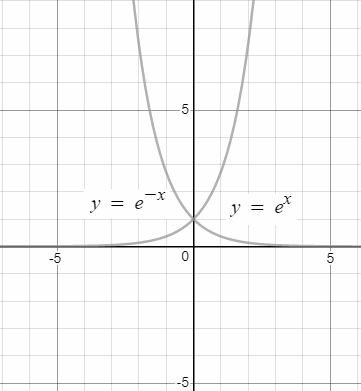
From above graphs following points can be noticed:
- f(x) increases with the increase in x.
- The slope of the graph increases with the increase in x.
- All exponential curves pass through (0,1).
- The curves do not pass through the x-axis. They just get closer and closer to the x-axis as we take smaller values of x.
- The curves for fx= px and f(x)= p-x are mirror image of each other.
Logarithm functions
Logarithmic functions are the inverse of exponential functions. These are functions of the form f(x) = logb x where b > 0. Here, b is known as the base of the logarithmic function. We do not consider a = 1, as this will not give a valid function.
For example, we know that the following exponential equation is true:
52 = 25 ; In this case, the base is 5 and the exponent is 2. We can write this equation in logarithmic form as
log525 = 2. We say this as “the logarithm of 25 to the base 5 is 2.
The 2 most common bases are base 10 and base e, which we say in log to base 10 and natural log (ln).
The logarithmic function can be used in many real-life applications such as in acoustics, in electronics, for earthquake analysis and prediction of population.
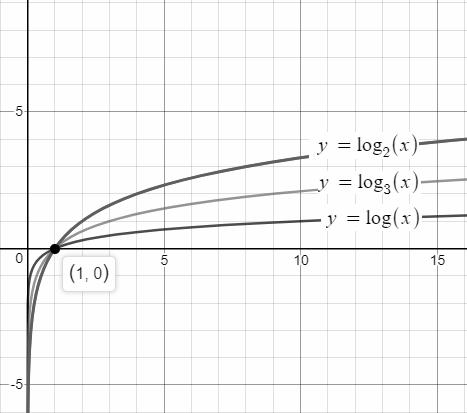
The plot of logarithmic function for different base values shows that the graph passes through (1,0), and as the base increases, the plot reaches near the x-axis.
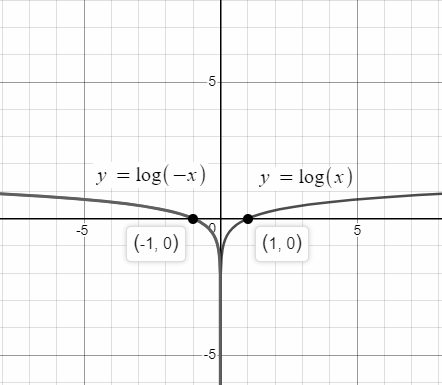
The plot of the logarithmic function for the same base but positive and negative values shows that the graph passes through (1,0) for positive values of x, and the graph passes through (-1,0) for negative values of x. These two graphs are mirror images of each other.
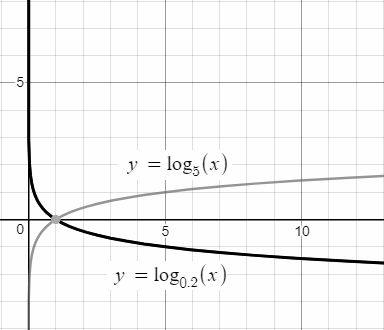
The graph of f(x) = logbx and f(x) = log1/bx are mirror image of each other about the X-axis.
Graphical Comparison of Exponential and Logarithmic Function
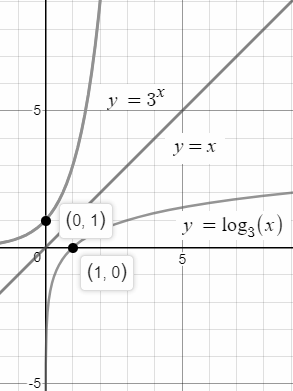
The graph of f(x) = logbx is symmetrical to the graph of f(x) = bx with respect to the line y = x. This relationship is valid for any function and its inverse.
Conclusion
From the above discussions of the exponential function we learned that a function of the form f(x) = px (where p > 0) is known as an exponential function. The function f(x) = 1x is a constant function f(x) = 1. The function f(x) = px for p > 1 has a graph closer to the x-axis for negative x and increases rapidly for positive values of x. The function f(x) = px for 0 < p < 1 has a graph which is close to the x-axis for positive values x and increases rapidly for decreasing negative values of x. For any value of p, the graph passes through the point (0, 1). The graph of f(x) = (1/p)x = p −x is a reflection, in the vertical axis, of the graph of f(x) = px . f(x) = e x is a particularly important exponential function, where e = 2.718 .
In the discussion of logarithmic function we learned that a function of the form f(x) = logbx (where b > 0 and b ≠ 1) is known as a logarithm function. The function f(x) = logbx for b> 1 has a graph closer to the negative x -axis for x < 1 and increases slowly for positive values of x. The function f(x) = logbx for 0 < b < 1 has a graph which is close to the positive x-axis for x < 1 and decreases slowly for positive values of x. For any value of b, the graph always passes through the point (1, 0). The graph of f(x) = log1/b x is a reflection of the graph of f(x) = logbx in the horizontal axis. f(x) = logex is a particularly important logarithm function where e = 2.718 and it is known as natural logarithm function, and is written f(x) = ln x. The exponential function f(x) = ex and the logarithm function f(x) = ln x are inverse of each other.