When it comes to measurements of the distribution, the standard deviation is a statistical tool of prime importance. The mathematical expression of standard deviation is calculated as the square root of the variance of the distribution. The standard deviation is generally denoted by sigma (σ). In continuous data, the ranges are mentioned along with their frequencies. Standard deviation basically recognizes how much the individual values of the data deviate or vary from the mean. It gives an indication about the distribution of the data, how much scattered or concentrated it is around the mean. Thus, standard deviation provides more information about the data than the mean alone would.
Standard Deviation for Continuous Distribution
Let us first know the Standard Deviation meaning!
The measure of dispersion around the mean, defined as the positive square root of the variance, is called standard deviation for a set of data. It assesses the spread or dispersion of data.
The standard deviation of a set of data may be calculated using the following formula:
Standard Deviation Formula

Standard Deviation For Continuous Frequency Distribution
The standard deviation for continuous distribution is a measurement of its spread. It calculates the standard deviation of the distance between each data point and the mean.
The standard deviation formula we apply depends on whether the data is regarded as a population on its own or a sample representing a larger population.
How is Standard Deviation calculated?
Three variables are used in the standard deviation formula. The value of each point in a data set is the first variable, with a sum-number representing each additional variable (x, x1, x2, x3, etc). The variable M’s values and the number of data points assigned to the variable n are both averaged. The average of the squared deviations from the arithmetic means is known as a variance.
The mean value is calculated by adding the values of the data pieces together and dividing the total by the number of data entities involved.
The square root of the mean of the squares of all the values of a series obtained from the arithmetic mean, also known as the root-mean-square deviation, is represented by the symbol. Because standard deviation cannot be negative, 0 is the smallest value. The standard deviation is larger when the items in a series are more distanced from the mean.
The statistical tool of standard deviation is a measure of dispersion that calculates the erroneousness of data dispersion. The metrics of central tendency, for example, are mean, median, and mode. As a result, these are known as the central first-order averages. The measurements of dispersion indicated right above are averages of deviations resulting from average values, and so are referred to as second-order averages.
- We divide by the number of data points, N, if the data is regarded as a population on its own
- If the data is a selection from a bigger group, we divide by one less than the number of data points in the sample, n-1, n minus 1
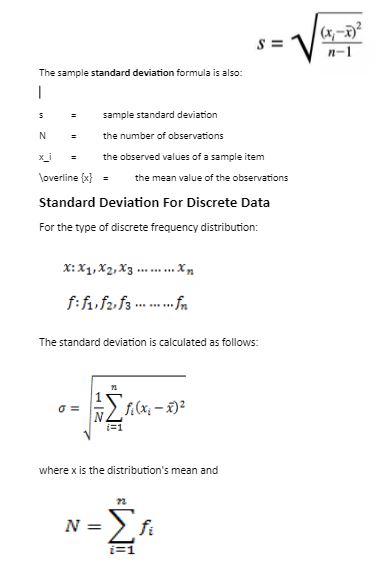
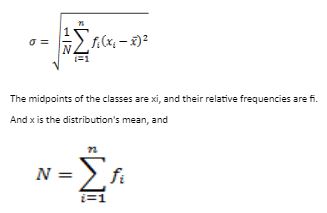
When computing the standard deviation for continuous distribution, the mid-point of each class is taken into account. The standard deviation of a frequency distribution of n classes is defined as its mid-point xi with frequency fi:

Population standard deviation
Here’s how to figure out the standard deviation calculator of a population:
Step 1: Determine the data’s mean—this is mu in the formula.
Step 2: Take the mean of each data point and subtract it. Deviations are the term for these differences. Negative deviations apply to data points below the mean, while positive deviations apply to data points above the mean.
Step 3: To make each deviation positive, square it.
Step 4: Combine the squared deviations.
Step 5: Multiply the total by the population’s number of data points. The variance is the name given to the outcome.
Step 6: To calculate the standard deviation, take the square root of the variance.
Sample standard deviation
Here’s how to figure out the standard deviation of a sample:
Step 1: Determine the data’s mean—this is the x bar at the top of the formula.
Step 2: Take the mean of each data point and subtract it. Deviations are the term for these differences. Negative deviations apply to data points below the mean, while positive deviations apply to data points above the mean.
Step 3: To make each deviation positive, square it.
Step 4: Combine the squared deviations.
Step 5: Subtract one from the total to get the number of data points in the sample. The variance is the name given to the outcome.
Step 6: To calculate the standard deviation, take the square root of the variance.
Standard Deviation of Ungrouped Data
Standard deviation estimates differ depending on the data. The deviation of data from its mean or average position is measured by distribution. The standard deviation for ungrouped data can be calculated in two ways.
- actual mean method
- assumed mean method
Standard deviation by Assumed Mean Method
When the x values are significant, the mean is set to an arbitrary number (A). d = x – A is used to compute the deviation from the assumed mean.
σ = √[(∑(d)^²/n) – (∑d/n)^²]
Standard Deviation Tips:
- The standard deviation is defined as the square root of the average of the squared deviations of data observations from the mean with n as the sample or population size
- The positive square root of the variance is the standard deviation
- The standard deviation is a measure of the dispersion of data points around the mean
Conclusion
The standard deviation is a statistical tool of prime importance. The standard deviation is generally denoted by sigma (σ). The measure of dispersion around the mean, defined as the positive square root of the variance, is called standard deviation for a set of data. It assesses the spread or dispersion of data.
The positive square root of the variance is the standard deviation.
 Profile
 Settings
 Refer your friends
 Sign out


