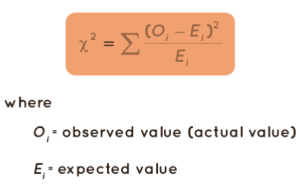
The difference between observed and expected data values is calculated using the Chi-square method, which is used in statistics. It’s used to see how closely actual and expected data match up. We can use the chi-square value to figure out how statistically significant the difference between expected and observed data is. A low chi-square value indicates that any differences between the actual and expected data are due to chance.
Chi Square Statistic
A chi-square statistic is a test that assesses how well a model matches actual data. A chi-square statistic desire data that is random, raw, mutually exclusive, drawn from independent variables, and drawn from a large enough sample. The outcomes of a fair coin toss, for example, meet these criteria.
In hypothesis testing, chi-square tests are frequently used. The chi-square statistic compares the size of any discrepancies between the expected and actual results.
These tests use degrees of freedom to determine whether a null hypothesis can be rejected based on the total number of variables and samples in the experiment. The larger the sample size, as with any statistic, the more reliable the results.
Chi Square Statistic Calculator
The goodness of fit test, also known as the chi-square test, can be performed with the help of the chi-square calculator. When determining whether your data is consistent with the expected distribution, this statistic is used. Learn how to calculate the chi-square value and use chi-square tables to assess the quality of your data by reading on. Make sure to check out our p-value calculator as well.
Using the formula below, calculate the chi-square value:
2 = (observed value – expected value)² / expected value
For instance, suppose you wanted to give a grade of 5 to 15% of your students. With this highest grade, you were able to grade 5 out of 60 students. There are 9 students in a class of 60. As a result, the chi-square statistic is used.
χ2 = (5 – 9)² / 9 = (-4)² / 9 = 16/9 = 1.778
What is p-value in Chi Square Statistic?
The p-value in a chi-square analysis is the probability of getting a chi-square as large as or larger than that in the current experiment while still having the data support the hypothesis. It’s the likelihood that deviations from the expected are due to chance.
Chi Square Statistic Formula

Figure 1
Chi Square Formula Applications
- Biologists use it to see if two variables have a significant relationship, such as the relationship between two species in a community.
- Genetic analysts use this to interpret the numbers in different phenotypic classes.
- Used in a variety of statistical procedures to help determine whether to accept or reject a hypothesis
Importance of Chi Square Statistic
The chi-square test is a statistical test that compares observed and expected outcomes. The goal of this test is to figure out whether a difference between observed and expected data is due to chance or a relationship between the variables you’re looking at.
Conclusion
A chi-square test is used to see if observed results match expected results and to rule out the possibility that observations are random. When the data being analyzed is from a random sample and the variable in question is a categorical variable, a chi-square test is appropriate. A categorical variable includes options such as car type, race, educational attainment, male vs. female, and how much someone likes a political candidate (from very much to very little), among others.
 Profile
 Settings
 Refer your friends
 Sign out


